Summary: US producer price index (PPI) up 0.5% in April, more than expected; annual rate accelerates to 2.2%; “core” PPI up 0.5% over month, up 2.4% over year; Westpac: sizeable downside revision to previous month, supportive of further disinflation; US Treasury yields fall; rate-cut expectations firm; services prices up 0.6%, goods prices up 0.4%.
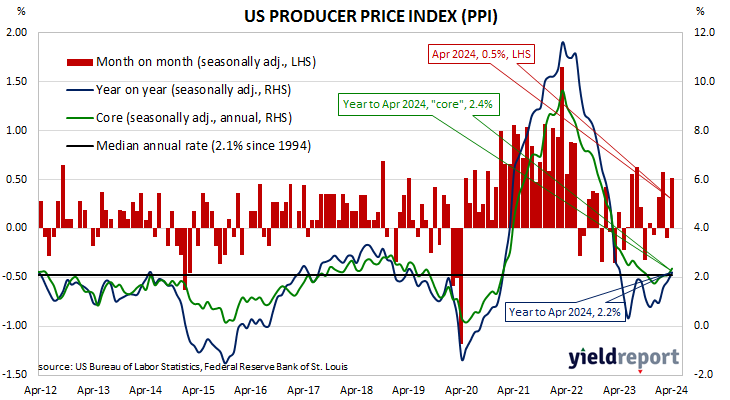
Around the end of 2018, the annual inflation rate of the US producer price index (PPI) began a downtrend which continued through 2019. Months in which producer prices increased suggested the trend may have been coming to an end, only for it to continue, culminating in a plunge in April 2020. Figures returned to “normal” towards the end of that year but then moved well above the long-term average in 2021 and 2022 before falling back over 2023.
The latest figures published by the Bureau of Labor Statistics indicate producer prices increased by 0.5% in April after seasonal adjustments. The result was more than the 0.3% increase which had been generally expected as well as March’s -0.1% after it was revised down from 0.2%. On a 12-month basis, the rate of producer price inflation after seasonal adjustments and revisions accelerated from March’s revised figure of 1.8% to 2.2%.
Producer prices excluding foods and energy, or “core” PPI, were also up 0.5% after seasonal adjustments. The result was greater than the 0.2% increase which had been generally expected and in contrast with March’s 0.1% decline after revisions. The annual growth rate accelerated from 2.1% to 2.4%, although it is worth noting March’s rate was revised down from 2.4%.
“An upside headline surprise in producer price inflation was tempered by a sizeable downside revision to the previous month and more constructive underlying detail,” said Westpac economist Jameson Coombs. “Overall the data was supportive of further disinflation and did little to move the dial on expectations for further inflation progress in tonight’s US consumer price inflation report.”
US Treasury bond yields fell moderately along the curve on the day. By the close of business, the 2-year Treasury yield had lost 4bps to 4.82%, the 10-year yield had shed 5bps to 4.44% while the 30-year yield finished 4bps lower at 4.59%.
In terms of US Fed policy, expectations of a lower federal funds rate in the next 12 months firmed a little, with three 25bp cuts currently factored in. At the close of business, contracts implied the effective federal funds rate would average 5.32% in June, a touch less than the current spot rate, 5.315% in July and 5.20% in September. May 2025 contracts implied 4.57%, 76bps less than the current rate.
The BLS stated 75% of the rise of the index was attributable to a 0.6% increase in services prices. The final demand goods index increased by 0.4%.
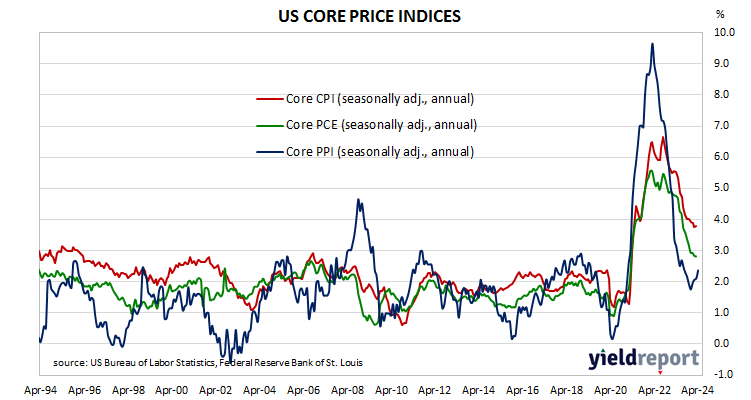
The producer price index is a measure of prices received by producers for domestically produced goods, services and construction. It is put together in a fashion similar to the consumer price index (CPI) except it measures prices received from the producer’s perspective rather than from the perspective of a retailer or a consumer. It is another one of the various measures of inflation tracked by the US Fed, along with core personal consumption expenditure (PCE) price data.