Summary: US industrial output contracts by 1.3% in September, contrasts with expected +0.2%; up 4.6% over past 12 months; data reminder supply bottle necks still affecting US economy; lingering effects of Hurricane Ida subtracts 0.6ppt; capacity utilisation rate falls 1ppt to 75.2%; back below February 2020 figure, still well below long-term average.
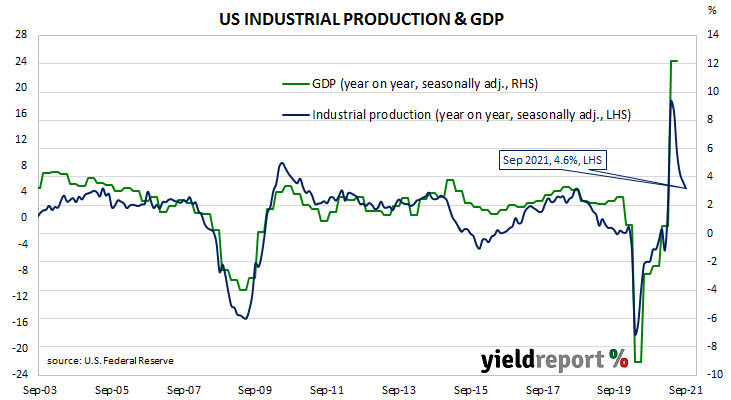
The Federal Reserve’s industrial production (IP) index measures real output from manufacturing, mining, electricity and gas company facilities located in the United States. These sectors are thought to be sensitive to consumer demand and so some leading indicators of GDP use industrial production figures as a component.US production collapsed through March and April of 2020 but then began recovering in subsequent months.
According to the Federal Reserve, US industrial production contracted by 1.3% on a seasonally adjusted basis in September. The result was in contrast to the 0.2% increase which had been generally expected and a larger contraction than August’s -0.1% after it was revised down from +0.4%. On an annual basis, the expansion rate slowed from August’s revised figure of 5.7% to 4.6%.
“The data is a reminder that although the US is less exposed to the energy crunch, supply bottlenecks are still affecting its economy, particularly in sectors [where] there is a shortage of workers, raw materials and chips,” said NAB currency strategist Rodrigo Catril.
Despite the report missing expectations, US Treasury bond yields generally moved higher on the day. By the close of business, the 2-year Treasury yield had gained 4bps to 0.43%, the 10-year yield had added 2bps to 1.59% while the 30-year yield finished unchanged at 2.04%.
The report stated production would have been an estimated 0.6% percentage points higher were it not “lingering effects of Hurricane Ida” which continued to affect mining and manufacturing operations.
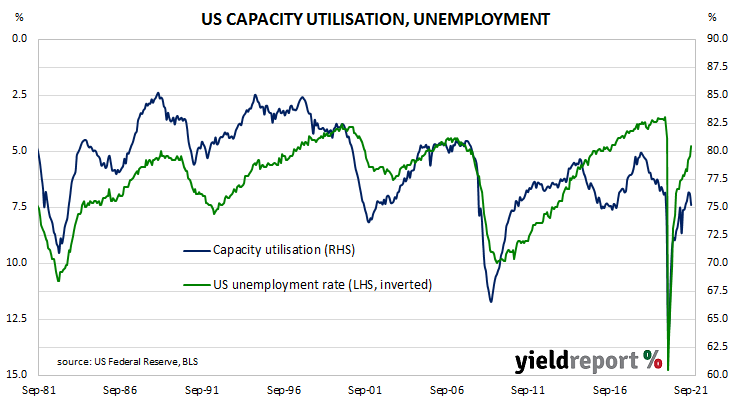
The same report includes US capacity utilisation figures which are generally accepted as an indicator of future investment expenditure and/or inflationary pressures. Capacity usage had hit a high for the last business cycle in early 2019 before it began a downtrend which ended with April 2020’s multi-decade low of 64.2%. September’s reading declined from August’s revised figure of 76.2% to 75.2%, back under February 2020’s reading of 76.3% and still well short of the long-term average of 80.1%.
While the US utilisation rate’s correlation with the US jobless rate is solid, it is not as high as the comparable correlation in Australia.