Summary: US CPI up 0.5% in January, in line with expectations; “core” rate up 0.4%; data stickier, disinflation to date less apparent; Treasury yields rise; rate-rise expectations firm; cyclical, market-driven price rises still too high; non-energy services prices main driver, adds 0.29 ppts.
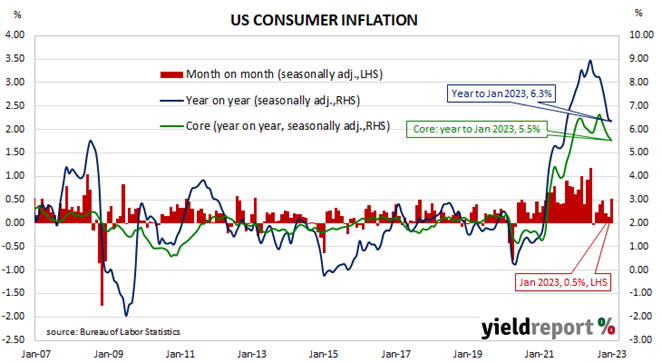
The annual rate of US inflation as measured by changes in the consumer price index (CPI) halved from nearly 3% in the period from July 2018 to February 2019. It then fluctuated in a range from 1.5% to 2.0% through 2019 before rising above 2.0% in the final months of that year. Substantially lower rates were reported from March 2020 to May 2020 and they remained below 2% until March 2021. Rates have since risen significantly.
The latest CPI figures released by the Bureau of Labor Statistics indicated seasonally-adjusted consumer prices increased by 0.5% on average in January. The result was in line with expectations but considerably higher than December’s 0.1% increase after it was revised from -0.1%. On a 12-month basis, the inflation rate slowed from 6.4% to 6.3%.
“Headline” inflation is known to be volatile and so references are often made to “core” inflation for analytical purposes. The core prices index, the index which excludes the more variable food and energy components, increased by 0.4% on a seasonally-adjusted basis for the month. The rise was in line with expectations as well as December’s increase and the annual growth rate slowed from 5.7% to 5.5%.
“While the thematics of inflation may be little changed as goods drivers slow or reverse, services inflation remains sticky, and shelter is high but poised to slow, the data is stickier than hoped and disinflation to date is less apparent than the data suggested just last month,” observed NAB economist Taylor Nugent.
US Treasury bond yields increased on the day, especially at the short end. By the close of business, the 2-year Treasury yield had jumped 8bps to 4.62%, the 10-year yield had gained 5bps to 3.75% while the 30-year yield finished 1bp higher at 3.79%.
In terms of US Fed policy, expectations of higher federal funds rates over the next 12 months firmed, especially regarding the second half of 2023. At the close of business, contracts implied the effective federal funds rate would average 4.66% in March, 8bps higher than the current spot rate, and then climb to an average of 4.845% in April. May futures contracts implied a 5.035% average effective federal funds rate while December contracts implied 5.13%.
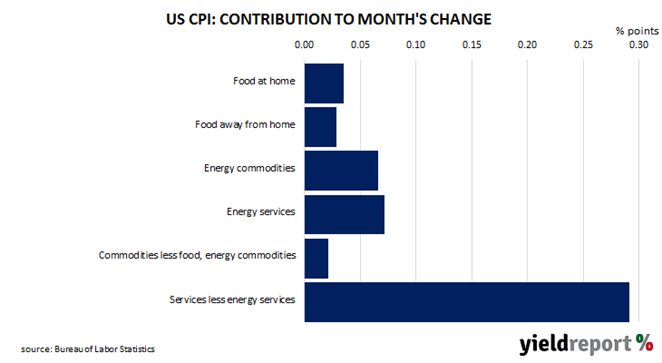
“Cyclical and market-driven price rises remain too high. For example, transportation services, 5.8% of the index, rose 0.9%,” said ANZ economist Kishti Sen.
The largest influence on headline results is often the change in fuel prices. Prices of “Energy commodities”, the segment which contains vehicle fuels, increased by 1.9% and contributed 0.07 percentage points to the total. However, prices of non-energy services, the segment which includes actual and implied rents, had the largest effect on the total, adding 0.29 percentage points after increasing by 0.5% on average.