
Summary: US output expands in January; rise much higher than expected figure; capacity utilisation rate increase above 75%; data “encouraging” but still below pandemic levels.
The Federal Reserve’s industrial production (IP) index measures real output from manufacturing, mining, electricity and gas company facilities located in the United States. These sectors are thought to be sensitive to consumer demand and so some leading indicators of GDP use industrial production figures as a component. Production began recovering in May 2020 and subsequent months after collapsing in the previous two months.
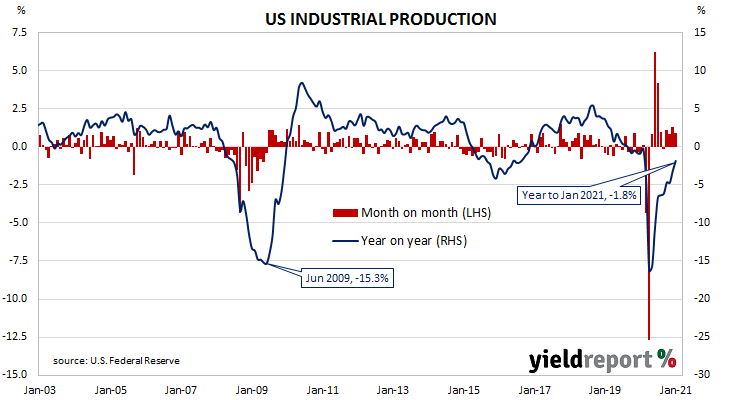
US industrial production expanded by 0.9% on a seasonally adjusted basis in January. The result was much higher than the 0.4% increase which had been generally expected but less than December’s 1.3% rise after it was revised down from 1.6%. On an annual basis, the contraction rate decreased from December’s revised figure of -3.2% to -1.8%.
The report was released on the same day as January PPI figures, January retail sales numbers and the minutes of the FOMC’s January meeting. Despite the robust figures, US Treasury bond yields moved lower across the curve, aided by a paragraph in the minutes which stressed the need to “abstract from temporary factors affecting inflation”. By the end of the day, the 2-year Treasury yield had shed 2bps to 0.10%, the 10-year yield had lost 4bps to 1.27% while the 30-year yield finished 5bps lower at 2.04%.
The same report includes US capacity utilisation figures which are generally accepted as an indicator of future investment expenditure and/or inflationary pressures. Capacity usage had hit a high for the last business cycle in early 2019 before it began a downtrend which ended with April’s multi-decade low of 64.2%. January’s reading increased to 75.6% from December’s revised figure of 74.9%.