
Summary: US industrial output down 0.6% in July, contrasts with expected flat result; down 0.2% over past 12 months; Barclays: underlying trajectory “roughly sideways”; US Treasury yields up; rate-cut expectations soften; capacity utilisation rate falls to 77.8%.
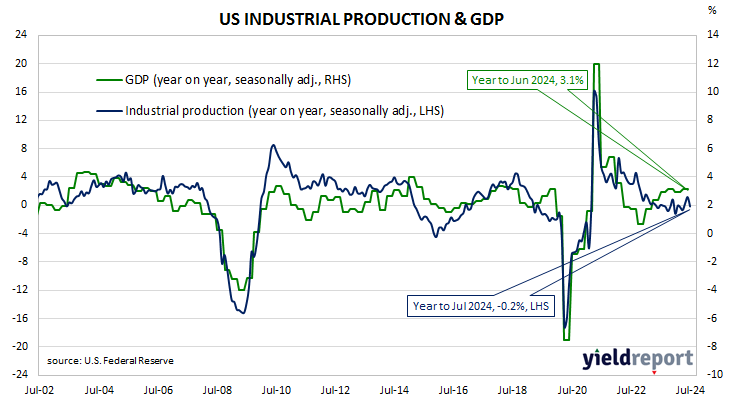
The Federal Reserve’s industrial production (IP) index measures real output from manufacturing, mining, electricity and gas company facilities located in the United States. These sectors are thought to be sensitive to consumer demand and so some leading indicators of GDP use industrial production figures as a component. US production collapsed through March and April of 2020 before recovering the ground lost over the fifteen months to July 2021. However, production levels has largely stagnated since early 2022.
According to the Federal Reserve, US industrial production fell by 0.6% on a seasonally adjusted basis in July. The contraction contrasted with the flat result which had been generally expected as well as June’s downwardly-revised 0.3% rise. The annual growth rate went into reverse, from June’s downwardly revised figure of 1.1% to -0.2%.
“Industrial production fell 0.6% in July, dragged down by a drop in auto assemblies, disruptions from Hurricane Beryl, and lower utilities production,” said Barclays senior economist Barclays Jonathan Millar. “Looking through these transitory influences, we continue to regard the underlying trajectory of industrial activity and manufacturing as roughly sideways.”
The figures came out on the same morning as the latest retail sales numbers and short-term US Treasury bond yields increased significantly on the day while longer-term yields rose more moderately. By the close of business, the 2-year Treasury yield had jumped 13bps to 4.09%, the 10-year yield had gained 8bps to 3.91% while the 30-year yield finished 5bps higher at 4.17%.
In terms of US Fed policy, expectations of a lower federal funds rate in the next 12 months softened, although around seven 25bp cuts are still currently factored in. At the close of business, contracts implied the effective federal funds rate would average 5.195% in September, 4.785% in November and 4.575% in December. July 2025 contracts implied 3.595%, 173bps less than the current rate.
The same report includes capacity utilisation figures which are generally accepted as an indicator of future investment expenditure and/or inflationary pressures. Capacity usage hit a high for the last business cycle in early 2019 before it began a downtrend which ended with April 2020’s multi-decade low of 64.2%. July’s reading fell by 0.6 percentage points after revisions to 77.8%, 2.3 percentage points below the long-term average.
While the US utilisation rate’s correlation with the US jobless rate is solid, it is not as high as the comparable correlation in Australia.
