
The Melbourne Institute’s Inflation Gauge is an attempt to replicate the ABS consumer price index (CPI) on a monthly basis instead of quarterly. It has turned out to be a reliable leading indicator of the CPI, although there are periods in which the Inflation Gauge series and the CPI have diverged, only for the two series to eventually converge over the space of six to twelve months.
During December, the Inflation Gauge increased by 0.1%, taking the annual rate to 2.3%. In November, the comparable figures were 0.2% and 2.7%.
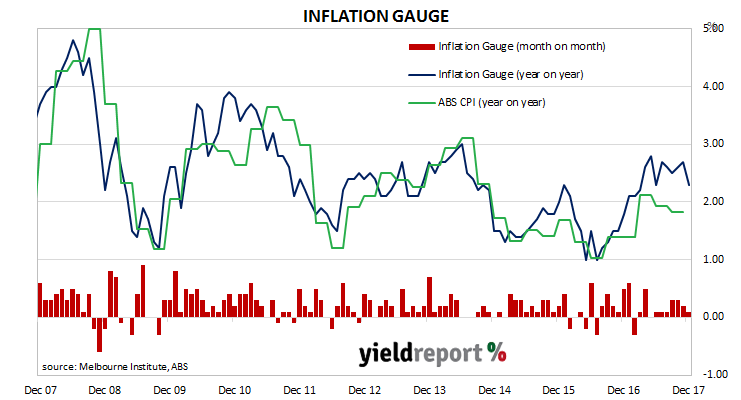
As a leading indicator, one would expect official CPI figures to follow the Melbourne Institute measure. Readers will note from the chart above how the Inflation Gauge has reversed direction in the past and one should not read too much into one month’s numbers. The Inflation Gauge’s annual rate also tends to overestimate changes in the CPI inflation by about 0.08%.