
Summary: Prices received by US producers increase; change more than expected; driven by higher goods prices, services prices fall.
Around the end of 2018, the annual inflation rate of the US producer price index (PPI) began a downtrend which then continued through 2019. Months in which prices received by producers increased suggested the trend may have been coming to an end, only for it to continue. April’s report changed that.
The latest figures published by the Bureau of Labor Statistics indicate producer prices increased by 0.4% after seasonal adjustments in May. The increase was greater than the 0.1% rise which had been generally expected and a turnaround from April’s -1.3%. On a 12-month basis, the rate of producer price inflation after seasonal adjustments remained negative at -0.8% after recording -1.0% in April and +0.7% in March.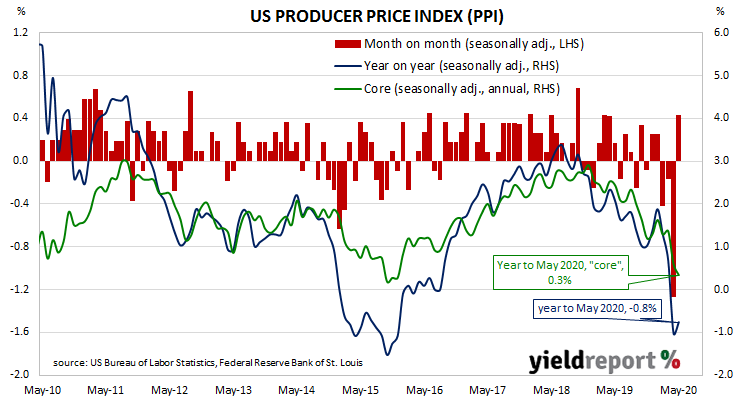
“Core” PPI inflation slipped by 0.1%, a smaller decline than April’s -0.3%. The annual rate halved from 0.6% to 0.3%.
US Treasury bond yields finished considerably lower at the long end as US equity markets tumbled amid demand for safe assets. By the end of the day, the US 2-year yield had gained 2bps to 0.20%, the 10-year yield had lost 5bps to 0.67% and the 30-year yield had shed 10bps to 1.40%.
The BLS stated prices for final demand goods were behind the month’s increase as they increased by 1.6%. Prices of services fell by 0.2%.
The producer price index (PPI) is a measure of prices received by producers for domestically produced goods, services and construction. It is put together in a fashion similar to the consumer price index (CPI) except it measures prices received from the producer’s perspective rather than from the perspective of a retailer or a consumer. It is another one of the various measures of inflation tracked by the US Fed, along with core personal consumption expenditure (PCE) data.