
Summary: ISM purchasing managers index (PMI) up; above consensus expectation; highest reading since 1983; implies US economy growing at rapid pace.
US purchasing managers’ index (PMI) readings reached a cyclical peak in September 2017 before they started a downtrend which ended in March 2020 with a contraction in US manufacturing which lasted until June 2020. Subsequent month’s readings implied growth had resumed and the early months of 2021 have provided elevated readings.
According to the latest Institute of Supply Management (ISM) survey, its Purchasing Managers Index recorded a reading of 64.7% in March. The result was above the generally expected figure of 60.5% and higher than February’s reading of 60.8%. The average reading since 1948 is 52.9% and any reading above 50% implies an expansion in the US manufacturing sector relative to the previous month.
ANZ economist Hayden Dimes noted the index had “reached its highest level since 1983”, pushed “by the strongest orders and production readings in 17 years.”
Purchasing Managers’ Indices (PMIs) are economic indicators derived from monthly surveys of executives in private-sector companies. They are diffusion indices, which means a reading of 50% represents no change from the previous period, while a reading under 50% implies respondents reported a deterioration on average. According to the ISM, a reading “above 42.8%, over a period of time, generally indicates an expansion of the overall economy,”
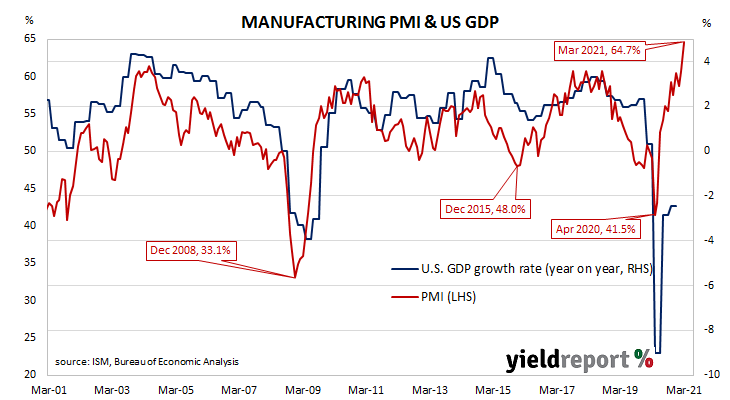
Manufacturing PMI figures appear to lead US GDP by several months despite a considerable error in any given month. The chart below shows US GDP on a “year on year” basis (and not the BEA annualised basis) against US GDP implied by monthly PMI figures.