
Summary: ISM PMI down in June, below expectations; ANZ: data point to subdued demand; short-term US Treasury yields steady, longer-term yields up; expectations of Fed rate cuts firm; ISM: reading corresponds to 1.7% US GDP growth annualised.
The Institute of Supply Management (ISM) manufacturing Purchasing Managers Index (PMI) reached a cyclical peak in September 2017. It then started a downtrend which ended in March 2020 with a contraction in US manufacturing which lasted until June 2020. Subsequent month’s readings implied growth had resumed, with the index becoming stronger through to March 2021. Readings then declined fairly steadily until mid-2023 and have since generally stagnated.
According to the ISM’s June survey, its PMI recorded a reading of 48.5%, below the generally expected figure of 49.1% as well as May’s reading of 48.7%. The average reading since 1948 is roughly 53.0% and any reading below 50% implies a contraction in the US manufacturing sector relative to the previous month.
“Looking at the components, production and employment fell into contractionary territory,” said ANZ senior economist Catherine Birch. “New orders improved from May but were weak overall. Prices paid fell from 57.0 to 52.1. Imports, exports and inventories fell. Overall, the data point to subdued demand.”

Short-term US Treasury bond yields remained stable on the day while longer=term yields rose noticeably. By the close of business, the 2-year Treasury bond yield had returned to its starting point at 4.76%, the 10-year yield had gained 6bps to 4.46% while the 30-year yield finished 7bps higher at 4.63%.
In terms of US Fed policy, expectations of a lower federal funds rate in the next 12 months firmed slightly, with almost four 25bp cuts currently factored in. At the close of business, contracts implied the effective federal funds rate would average 5.305% in August, 3bps less than the current spot rate, 5.245% in September and 5.085% in November. June 2025 contracts implied 4.375%, 96bps less than the current rate.
Purchasing managers’ indices (PMIs) are economic indicators derived from monthly surveys of executives in private-sector companies. They are diffusion indices, which means a reading of 50% represents no change from the previous period, while a reading under 50% implies respondents reported a deterioration on average. A reading “above 42.5%, over a period of time, generally indicates an expansion of the overall economy”, according to the ISM’s latest calculations.
The ISM’s manufacturing PMI figures appear to lead US GDP by several months despite a considerable error in any given month. The chart below shows US GDP on a “year on year” basis (and not the BEA annualised basis) against US GDP implied by monthly PMI figures.
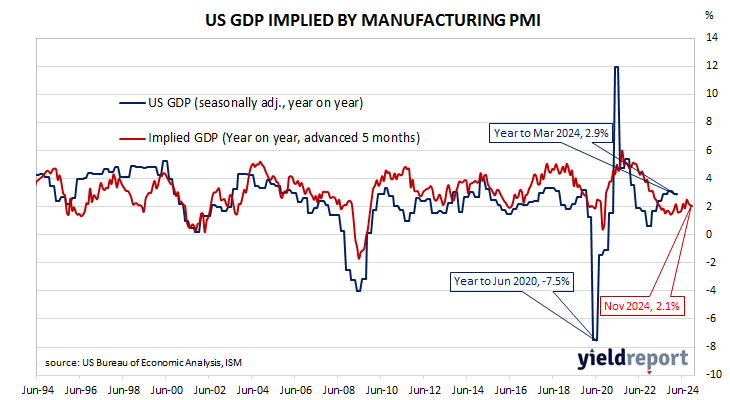
According to the ISM and its analysis of past relationships between the PMI and US GDP, June’s PMI corresponds to an annualised growth rate of 1.7%, or about 0.4% over a quarter. Regression analysis on a year-on-year basis suggests a 12-month GDP growth rate of 2.1% five months after this latest report.
The ISM index is one of two monthly US PMIs, the other being an index published by S&P Global. S&P Global produces a “flash” estimate in the last week of each month which comes out about a week before the ISM index is published. The S&P Global flash June manufacturing PMI registered 51.7%, up 0.4 percentage points from May’s final figure.