
Summary: ISM purchasing managers index (PMI) down; almost in line with consensus expectation; “remains robust”; reading implies US economy growing at solid pace.
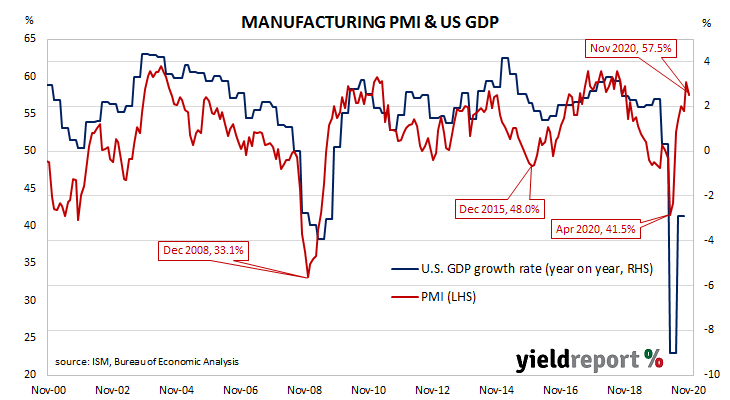
US purchasing managers’ index (PMI) readings reached a cyclical peak in September 2017 before they started a downtrend which stabilised in late 2019 after a truce of sorts was made with the Chinese regarding trade. March’s report signalled a contraction in US manufacturing activity had begun and it stayed in this state until June. Subsequent month’s readings have implied a return to expansion for US manufacturing.
According to the latest Institute of Supply Management (ISM) survey, its Purchasing Managers Index recorded a reading of 57.5% in November. The result was just below the consensus figure of 57.6% and lower than October’s reading of 59.3%. The average reading since 1948 is 52.9% and any reading above 50% implies an expansion in the US manufacturing sector.
ANZ analyst Rahul Khare said, “Growth in the US manufacturing sector eased slightly but remains robust.”
Purchasing Managers’ Indices (PMIs) are economic indicators derived from monthly surveys of executives in private-sector companies. They are diffusion indices, which means a reading of 50% represents no change from the previous period, while a reading under 50% implies respondents reported a deterioration on average. According to the ISM, a reading “above 42.8%, over a period of time, generally indicates an expansion of the overall economy,”
Manufacturing PMI figures appear to lead US GDP by several months despite a considerable error in any given month. The chart below shows US GDP on a “year on year” basis (and not the BEA annualised basis) against US GDP implied by monthly PMI figures.