
Summary: ISM PMI down in October, below expectations; ANZ: dents expectations US manufacturing may be bottoming out; US Treasury yields plunge; expectations of Fed rate cuts in 2024 harden; ISM: reading corresponds to 0.7% US GDP contraction annualised.
The Institute of Supply Management (ISM) manufacturing Purchasing Managers Index (PMI) reached a cyclical peak in September 2017. It then started a downtrend which ended in March 2020 with a contraction in US manufacturing which lasted until June 2020. Subsequent month’s readings implied growth had resumed, with the index becoming stronger through to March 2021. Readings have since declined fairly steadily.
According to the ISM’s October survey, its PMI recorded a reading of 46.7%, below the generally expected figure of 49.0% as well as September’s 49.0%. The average reading since 1948 is roughly 53.0% and any reading below 50% implies a contraction in the US manufacturing sector relative to the previous month.
“The October ISM manufacturing index fell to 46.7, its lowest reading since July and denting expectations that activity in the sector may be bottoming out,” said ANZ economist Kishti Sen.
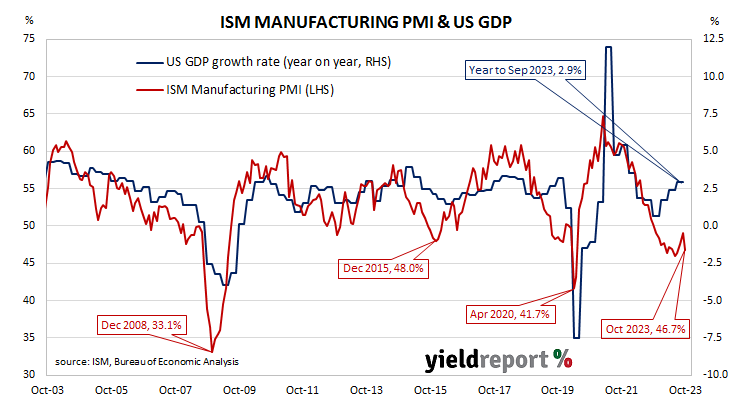
The report was released on the same day as the latest JOLTS data, ADP’s October report and the FOMC’s decision to hold its federal funds rate target range steady. US Treasury yields plunged on the day and, by the close of business, the 2-year Treasury bond yield had lost 14bps to 4.95%, the 10-year yield had shed 19bps to 4.74% while the 30-year yield finished 16bps lower at 4.93%.
In terms of US Fed policy, expectations of a lower federal funds rate in the second half of 2024 hardened. At the close of business, contracts implied the effective federal funds rate would average 5.355% in December, 3bps more than the current spot rate, 5.375% in January and 5.38% in March. November 2024 contracts implied 4.695%, 63bps less than the current rate.
Purchasing managers’ indices (PMIs) are economic indicators derived from monthly surveys of executives in private-sector companies. They are diffusion indices, which means a reading of 50% represents no change from the previous period, while a reading under 50% implies respondents reported a deterioration on average. A reading “above 48.7%, over a period of time, generally indicates an expansion of the overall economy”, according to the ISM.
The ISM’s manufacturing PMI figures appear to lead US GDP by several months despite a considerable error in any given month. The chart below shows US GDP on a “year on year” basis (and not the BEA annualised basis) against US GDP implied by monthly PMI figures.
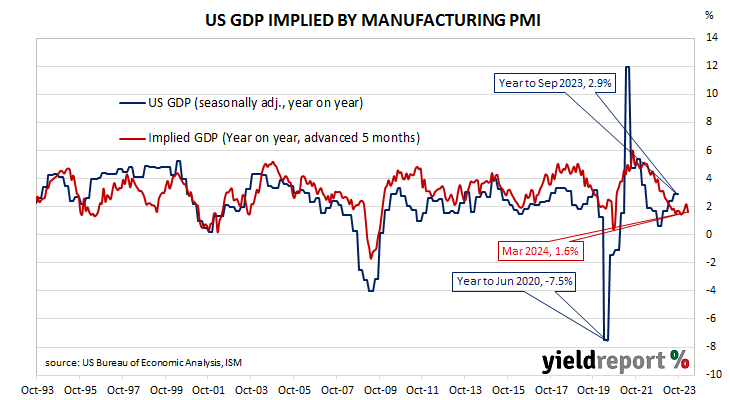
According to the ISM and its analysis of past relationships between the PMI and US GDP, October’s PMI corresponds to an annualised contraction rate of -0.7%, or about -0.2% over a quarter. However, regression analysis on a year-on-year basis still suggests a 12-month GDP growth rate of 1.6% five months after this latest report.
The ISM index is one of two monthly US PMIs, the other being an index published by S&P Global. S&P Global produces a “flash” estimate in the last week of each month which comes out about a week before the ISM index is published. The S&P Global flash October manufacturing PMI registered 50.0%, 0.2 percentage points higher than September’s final figure.