
Summary: ISM purchasing managers index moves further above 50; result exceeds expectations; manufacturing back into the expansionary territory; implies the US economy again growing at solid rate; employment still contracting.
US purchasing managers’ indices (PMIs) reached a cyclical peak in September 2017 before they started a downtrend which stabilised in late 2019 after a truce of sorts was made with the Chinese regarding trade. March’s report signalled a contraction in US manufacturing activity had begun which deepened through April and May before recovering in June.
According to the latest Institute of Supply Management (ISM) survey, its Purchasing Managers Index recorded a reading of 54.2% in July. The result was above the expected figure of 53.6% and higher than June’s final reading of 52.6%. The average reading since 1948 is 52.9% and any reading above 50% implies an expansion in the manufacturing sector. A reading “above 42.8%, over a period of time, generally indicates an expansion of the overall economy,” according to the ISM.
ANZ economist Adelaide Timbrell noted the index was at highest since March 2019. However, “employment is contracting, with that sub-gauge still below 50.0 at 44.3.”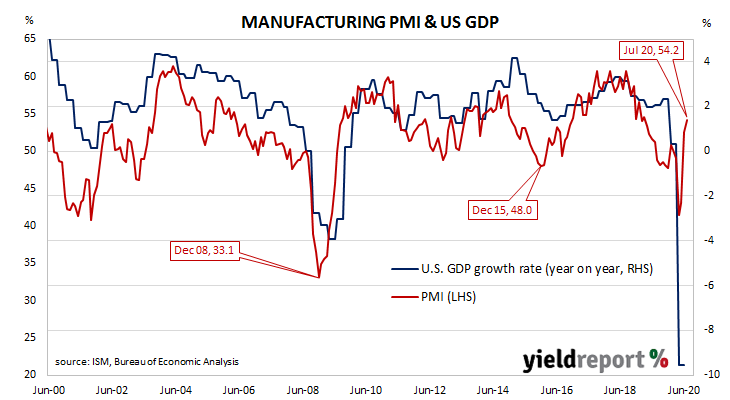
The report was released on the same day as the ADP June report and long-term US Treasury yields rose moderately. By the close of business, the 2-year Treasury bond yield remained unchanged at 0.11% while 10-year and 30-year yields had each increased by 3bps to 0.56% and 1.23% respectively.
Purchasing Managers’ Indices (PMIs) are economic indicators derived from monthly surveys of executives in private-sector companies. They are diffusion indices, which means a reading of 50% represents no change from the previous period, while a reading under 50% implies respondents reported a deterioration on average. They are particularly useful as a leading indicator.
Manufacturing PMI figures appear to lead US GDP by several months despite a considerable error in any given month. The chart below shows US GDP on a “year on year” basis (and not the BEA annualised basis) against US GDP implied by monthly PMI figures.