
Summary: ISM PMI up in February, slightly below expectations; companies slowing outputs to match demand in first half of 2023; US Treasury yields up, expectations of Fed rate rises harden; ISM: reading corresponds to 0.3% US GDP contraction annualised.
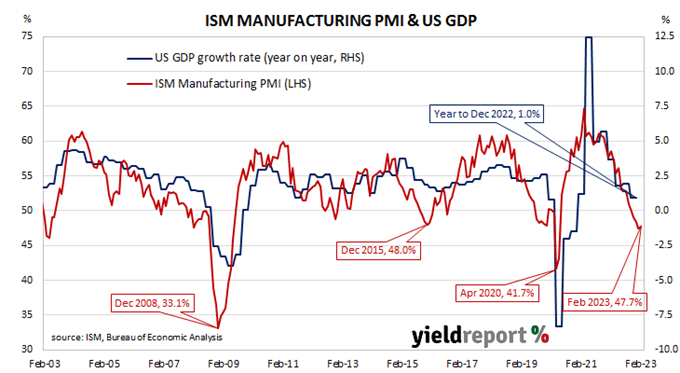
The Institute of Supply Management (ISM) manufacturing Purchasing Managers Index (PMI) reached a cyclical peak in September 2017. It then started a downtrend which ended in March 2020 with a contraction in US manufacturing which lasted until June 2020. Subsequent month’s readings implied growth had resumed, with the index becoming stronger through to March 2021. Since then, readings have declined steadily.
According to the ISM’s February survey, its PMI recorded a reading of 47.7%, slightly below the generally expected figure of 47.8% but above January’s 47.4. The average reading since 1948 is 53.0% and any reading below 50% implies a contraction in the US manufacturing sector relative to the previous month.
“With Business Survey Committee panellists reporting softening new order rates over the previous nine months, the February composite index reading reflects companies continuing to slow outputs to better match demand for the first half of 2023 and prepare for growth in the second half of the year,” said Timothy Fiore, Chair of the ISM’s Manufacturing Business Survey Committee.
US Treasury yields finished the day higher. By the close of business, the 2-year Treasury bond yield had gained 6bps to 4.88%, the 10-year yield had added 7bps to 4.00% while the 30-year yield finished 2bps higher at 3.95%.
In terms of US Fed policy, expectations of higher federal funds rates over the next 12 months hardened. At the close of business, contracts implied the effective federal funds rate would average 4.665% in March, 9bps higher than the current spot rate, and then climb to an average of 4.885% in April. May futures contracts implied a 5.125% average effective federal funds rate while December contracts implied 5.375%.
Purchasing managers’ indices (PMIs) are economic indicators derived from monthly surveys of executives in private-sector companies. They are diffusion indices, which means a reading of 50% represents no change from the previous period, while a reading under 50% implies respondents reported a deterioration on average. A reading “above 48.7%, over a period of time, generally indicates an expansion of the overall economy” according to the ISM.
The ISM’s manufacturing PMI figures appear to lead US GDP by several months despite a considerable error in any given month. The chart below shows US GDP on a “year on year” basis (and not the BEA annualised basis) against US GDP implied by monthly PMI figures.
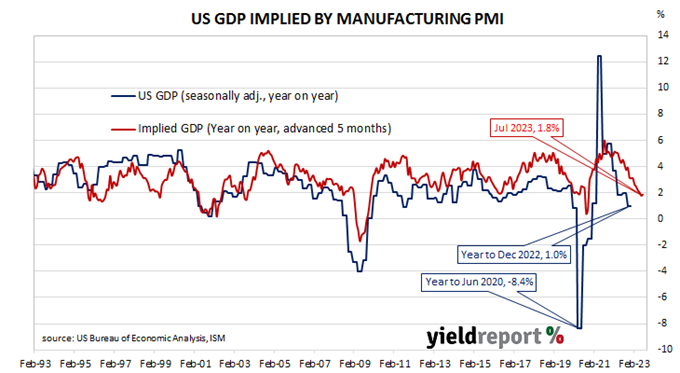
According to the ISM and its analysis of past relationships between the PMI and US GDP, February’s PMI corresponds to an annualised contraction rate of 0.3%, or 0.1% over a quarter. Regression analysis on a year-on-year basis suggests a 12-month GDP growth rate of 1.8% five months after this latest report.
The ISM index is one of two monthly US PMIs, the other being an index published by S&P Global. S&P Global produces a “flash” estimate in the last week of each month which comes out about a week before the ISM index is published. The S&P Global flash February manufacturing PMI registered 50.2%, 3.4 percentage points higher than January’s final figure.