
Summary: Leading index increases strongly for third consecutive month in October; first above-trend result since November 2018; index reading implies annual GDP growth to rise to around +6.00% early next year; RBA forecast implies 3.5% growth in second half of 2020.
Westpac and the Melbourne Institute describe their Leading Index as a composite measure which attempts to estimate the likely pace of Australian economic growth over the next three to six months. After reaching a peak in early 2018, the index trended lower through 2018, 2019 and the early months of 2020 before plunging to recessionary levels in the second quarter. Readings from the third quarter were markedly higher.
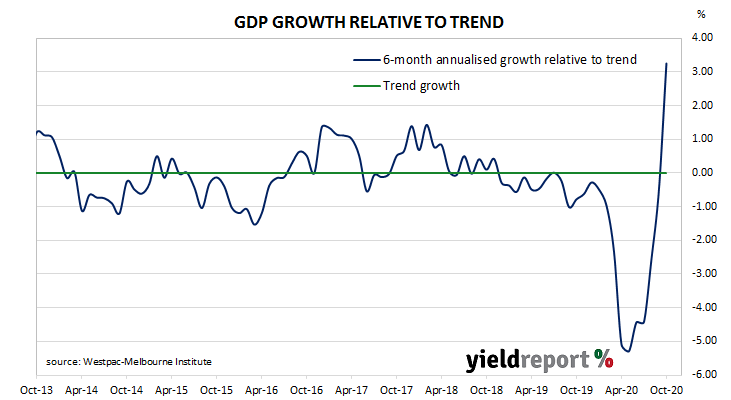
The latest reading of the six month annualised growth rate of the indicator increased strongly for a third consecutive month, from September’s revised figure of –0.45% to +3.25% in October.
“This is the first positive, above trend, growth rate since November 2018. It is also the strongest seen since the early 1980s,” said Westpac Chief Economist Bill Evans.
Index figures represent rates relative to trend-GDP growth, which is generally thought to be around 2.75% per annum. The index is said to lead GDP by three to six months, so theoretically the current reading represents an annualised GDP growth rate of around 6.0% in the first or second quarters of 2021.
The report was released on the same day as the September quarter’s wage indices and long-term Commonwealth Government bond yields fell more than their US counterparts had overnight. By the end of the day, 10-year and 20-year ACGB yields had each lost 7bps to 0.89% and 1.51% respectively. The 3-year yield slipped 1bp to 0.17%.