Summary: US CPI up 0.4% in April, as expected; “core” rate up 0.4%; NAB: seen as supportive for expectations of Fed pause; Treasury yields fall; rate-cut expectations harden; NAB: report detail “less convincing”; Citi: consistently too-strong pace of underlying inflation likely not be encouraging to Fed officials; non-energy services prices again main driver, adds 0.23 ppts.
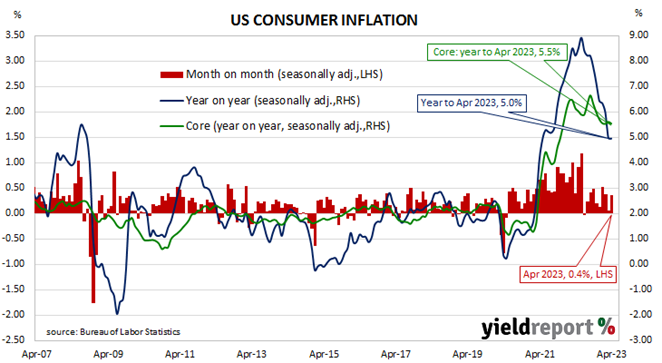
The annual rate of US inflation as measured by changes in the consumer price index (CPI) halved from nearly 3% in the period from July 2018 to February 2019. It then fluctuated in a range from 1.5% to 2.0% through 2019 before rising above 2.0% in the final months of that year. Substantially lower rates were reported from March 2020 to May 2020 and they remained below 2% until March 2021. Rates have since risen significantly, although they have been declining since mid-2022.
The latest US CPI figures released by the Bureau of Labor Statistics indicated seasonally-adjusted consumer prices increased by 0.4% on average in April. The result was in line with expectations but higher than March’s 0.1% rise. On a 12-month basis, the inflation rate remained unchanged at 5.0%.
“Headline” inflation is known to be volatile and so references are often made to “core” inflation for analytical purposes. The core prices index, the index which excludes the more variable food and energy components, also increased by 0.4% on a seasonally-adjusted basis over the month. The rise was in line with expectations as well as March’s increase. The annual growth rate ticked down from 5.6% to 5.5%, reversing the previous month’s rise.
“The headline numbers were in line with expectations and price action would suggest that this was seen as supporting expectations of a pause by the Fed at the next meeting,” said NAB Head of Markets Strategy Skye Masters.
US Treasury bond yields fell noticeably on the day, especially at the short end of the curve. By the close of business, the 2-year Treasury yield had shed 13bps to 3.91%, the 10-year yield had lost 9bps to 3.44% while the 30-year yield finished 5bps lower at 3.80%.
In terms of US Fed policy, expectations of a lower federal funds rate through the remainder of 2023 and into 2024 hardened considerably. At the close of business, contracts implied the effective federal funds rate would average 5.065% in June, 1bp less than the current spot rate, and then slip a touch to an average of 5.045% in July. September futures contracts implied a 4.90% average effective federal funds rate while May 2024 contracts implied 3.53%, 155bps less than the current rate.
While Masters thinks markets will see the headline figures as indicative of a declining inflation rate, she also noted “the detail though the inflation story is less convincing…” She pointed to a Federal Reserve Bank of Atlanta economist who, after the report’s release, stated “…it looks like underlying inflation has stepped down from extremely elevated to just really elevated.”
Citi economist Veronica Clark shared her sentiments. “We would caution that the consistently too-strong pace of underlying inflation around 5% will likely not be encouraging to Fed officials. While prices for some travel services were softer in April, other non-shelter services remain very strong.”
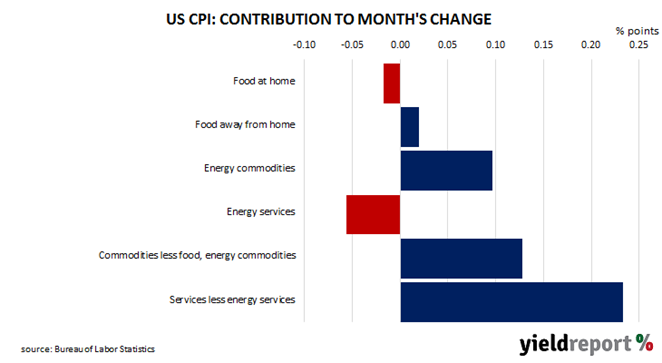
The largest influence on headline results is often the change in fuel prices. Prices of “Energy commodities”, the segment which contains vehicle fuels, increased by 2.7% and contributed 0.10 percentage points to the total. However, prices of non-energy services, the segment which includes actual and implied rents, again had the largest effect on the total, adding 0.23 percentage points after increasing by 0.4% on average.