
Summary: ISM PMI up from 57.1% to 56.1% in May, above expectations; labour shortages, input price inflation easing; prices-paid sub-index “consistent with extremely strong inflationary pressures” but lower employment sub-index indicates job shedding in manufacturing; latest reading implies 3.9% 12-month growth rate in October.
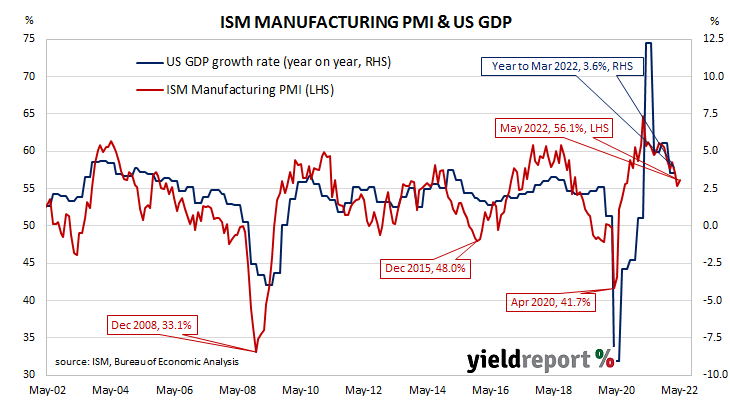
The Institute of Supply Management (ISM) manufacturing Purchasing Managers Index (PMI) reached a cyclical peak in September 2017. It then started a downtrend which ended in March 2020 with a contraction in US manufacturing which lasted until June 2020. Subsequent month’s readings implied growth had resumed, with the index becoming stronger through to March 2021. Since then, readings have remained at levels associated with solid economic growth despite some declines.
According to the ISM’s May survey, its PMI recorded a reading of 56.1%, above the generally expected figure of 55.0% as well as Aprils 55.4%. The average reading since 1948 is 53.0% and any reading above 50% implies an expansion in the US manufacturing sector relative to the previous month.
Timothy Fiore, Chair of the ISM’s Manufacturing Business Survey Committee, said progress was being made on labour shortages and input price inflation had eased somewhat. Survey respondents mostly reported still being optimistic with respect to customer demand.
US Treasury yields increased on the day, although not at the ultra-long end. By the close of business, the 2-year Treasury bond yield had jumped 9bps to 2.65% and the 10-year yield had gained 6bps to 2.91%. The 30-year yield finished unchanged at 3.06%.
In terms of US Fed policy, expectations of higher federal funds rates over the next 12 months firmed up. At the close of business, June contracts implied an effective federal funds rate of 1.08%, 25bps higher than the current spot rate while July contracts implied a rate of 1.405%. May 2023 futures contracts implied 3.165%, 234bps above the spot rate.
NAB currency strategist Rodrigo Catril said the prices-paid sub-index was “still consistent with extremely strong inflationary pressures” but noted the fall in the employment sub-index indicated “at face value, negative employment growth in the manufacturing sector.”
Purchasing managers’ indices (PMIs) are economic indicators derived from monthly surveys of executives in private-sector companies. They are diffusion indices, which means a reading of 50% represents no change from the previous period, while a reading under 50% implies respondents reported a deterioration on average.
A reading “above 48.7%, over a period of time, generally indicates an expansion of the overall economy” according to the ISM.
The ISM’s manufacturing PMI figures appear to lead US GDP by several months despite a considerable error in any given month. The chart below shows US GDP on a “year on year” basis (and not the BEA annualised basis) against US GDP implied by monthly PMI figures.
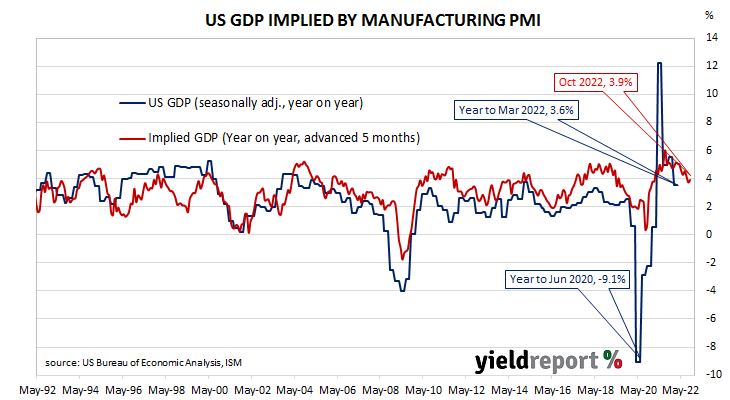
According to the ISM and its analysis of past relationships between the PMI and US GDP, May’s PMI corresponds to an annualised growth rate of 2.6%, or 0.6% over a quarter. Regression analysis on a year-on-year basis suggests a 12-month GDP growth rate of 3.9% five months after this latest report.
The ISM index is one of two monthly US PMIs, the other being an index published by IHS Markit. IHS Markit also produces a “flash” estimate in the last week of each month which comes out about a week before the ISM index is published. The IHS Markit May flash manufacturing PMI registered 57.5%, 1.7 percentage points lower than April’s final figure.