Summary: Non-farm payrolls up by 390,000 in May, above expectations; previous two months’ figures revised down by 22,000; jobless rate steady at 3.6%, participation rate ticks up; affirms “near-term path for continued Fed tightening”; jobs-to-population ratio creeps up; underutilisation rate ticks up to 7.1%; annual hourly pay growth slows to 5.2%.
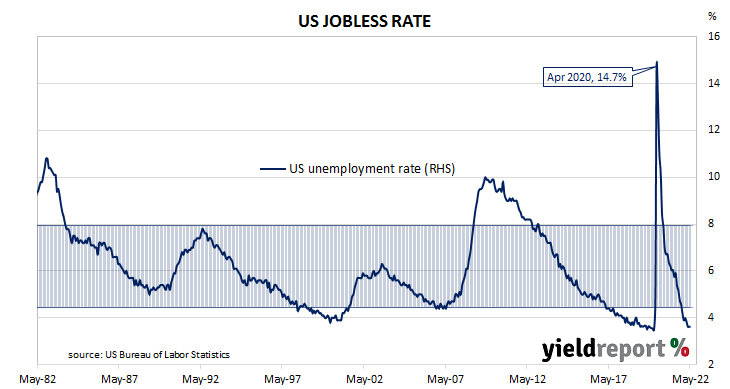
The US economy ceased producing jobs in net terms as infection controls began to be implemented in March 2020. The unemployment rate had been around 3.5% but that changed as job losses began to surge through March and April of 2020. The May 2020 non-farm employment report represented a turning point and subsequent months provided substantial employment gains. Changes in recent months have been generally more modest but also well above the long-term monthly average.
According to the US Bureau of Labor Statistics, the US economy created an additional 390,000 jobs in the non-farm sector in May. The increase was greater than the 320,000 increase which had been generally expected but a little lower than the 436,000 jobs which had been added in April after revisions. Employment figures for March and April were revised down by a total of 22,000.
The total number of unemployed increased by 9,000 to 5.950 million while the total number of people who are either employed or looking for work decreased by 0.330 million to 164.376 million. These changes led to the US unemployment rate remaining stable at April’s rate of 3.6%. The participation rate ticked up from April’s rate of 62.2% to 62.3%.
“Markets took the strong US payroll gains…as affirming the near-term path for continued Fed tightening,” said NAB economist Taylor Nugent.
US Treasury yields increased on the day, especially at the short end. By the close of business, the 2-year yield had gained 5bps to 2.68%, the 10-year yield had added 3bps to 2.94% while the 30-year yield finished 1bp higher at 3.09%.
In terms of US Fed policy, expectations for a higher federal funds rate over the next 12 months softened somewhat. At the close of business, June contracts implied an effective federal funds rate of 1.085%, 28bps higher than the current spot rate, while July contracts implied 1.405%. May 2023 futures contracts implied an effective federal funds rate of 3.205%, 238bps above the spot rate.
One figure which is indicative of the “spare capacity” of the US employment market is the employment-to-population ratio. This ratio is simply the number of people in work divided by the total US population. It hit a cyclical-low of 58.2 in October 2010 before slowly recovering to just above 61% in late-2019. May’s reading crept up from 60.0% to 60.1%, still some way from the April 2000 peak reading of 64.7%.
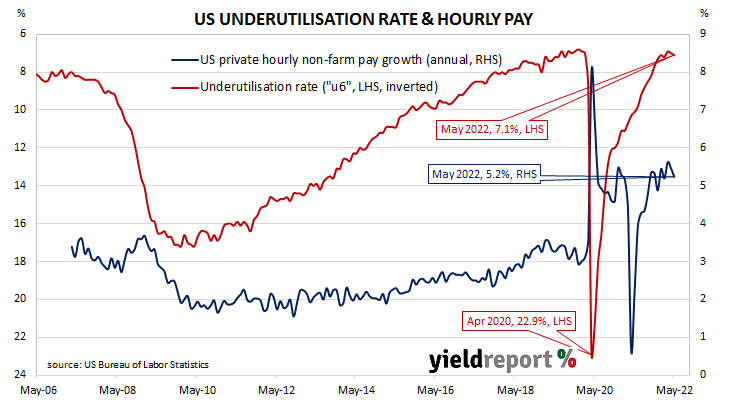
Wage growth spiked in the US during the early stages of pandemic restrictions as lower-paid jobs disappeared at a faster rate relative to higher-paid jobs, disrupting the usual relationship between wage inflation and unemployment rates. Normally, wages tend to grow as the supply of labour tightens.
Apart from the unemployment rate, another measure of tightness in the labour market is the underutilisation rate. The latest reading of it ticked up from 7.0% in April to 7.1%. Wage inflation and the underutilisation rate usually have an inverse relationship and hourly pay growth in the year to May slowed from April’s rate of 5.5% to 5.2%.