
Summary: Prices received by producers rise by 0.8% in May; double expected figure; annual rate moves further above 6%; “core” PPI increases by 0.7% again; points “to ongoing pipeline inflation pressure”; goods prices up 1.5%, services up 0.6%.
Around the end of 2018, the annual inflation rate of the US producer price index (PPI) began a downtrend which continued through 2019. Months in which producer prices increased suggested the trend may have been coming to an end, only for it to continue, culminating in a plunge in April 2020. Figures returned to “normal” towards the end of that year and annual rates are now well above average.
The latest figures published by the Bureau of Labor Statistics indicate producer prices rose by 0.8% after seasonal adjustments in May. The increase was double the 0.4% rise which had been generally expected and more than April’s 0.6% rise. On a 12-month basis, the rate of producer price inflation after seasonal adjustments increased from 6.1% to 6.5%.
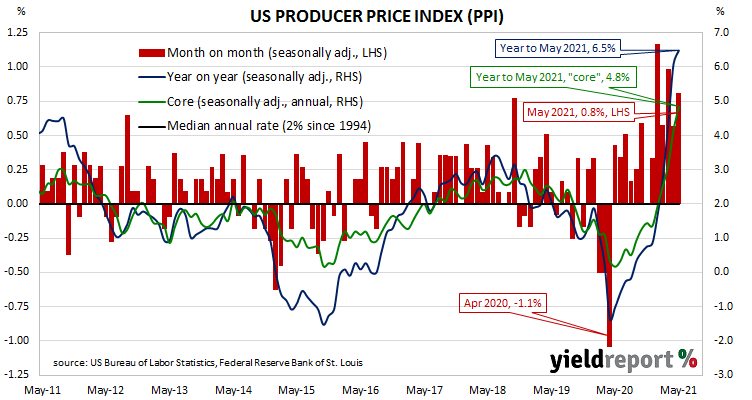
PPI inflation excluding foods and energy, or “core” PPI inflation, rose by 0.7%, the same rate as in April and March. The annual rate accelerated again, this time from 4.2% to 4.8%. ANZ economist Adelaide Timbrell said the figures point “to ongoing pipeline inflation pressure.”
The report was released on the same day as May’s retail sales and industrial production numbers but US Treasury bond yields hardly moved on the day as markets awaited this week’s FOMC meeting. By the end of the day, 2-year and 10-year Treasury yields remained unchanged at 0.16% and 1.50% respectively while the 30-year yield finished 1bp higher at 2.19%.
The BLS stated higher prices for final demand goods accounted for 60% of the month’s increase after they rose by 1.5% on average. Prices of final demand services rose by 0.6%.
The producer price index (PPI) is a measure of prices received by producers for domestically produced goods, services and construction. It is put together in a fashion similar to the consumer price index (CPI) except it measures prices received from the producer’s perspective rather than from the perspective of a retailer or a consumer. It is another one of the various measures of inflation tracked by the US Fed, along with core personal consumption expenditure (PCE) price data.