Summary: US industrial output down 0.3% in October, fall slightly larger than expected; down 0.3% over past 12 months; ANZ: strikes, hurricanes, hit production for second month; short-term US Treasury yields fall, longer-term yields either steady or up slightly; rate-cut expectations firm; capacity utilisation rate falls to 77.1%, below long-term average.
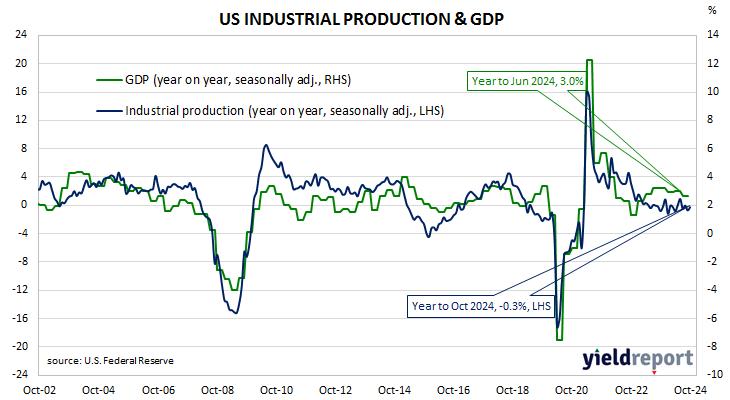
The Federal Reserve’s industrial production (IP) index measures real output from manufacturing, mining, electricity and gas company facilities located in the United States. These sectors are thought to be sensitive to consumer demand and so some leading indicators of GDP use industrial production figures as a component. US production collapsed through March and April of 2020 before recovering the ground lost over the fifteen months to July 2021. However, production levels has largely stagnated since early 2022.
According to the Federal Reserve, US industrial production decreased by 0.3% on a seasonally adjusted basis in October. The fall was a larger one than the 0.2% contraction which had been generally expected but it was a slightly smaller one than September’s downwardly-revised 0.5% contraction. However, the annual contraction rate slowed from September’s revised figure of 0.7% to 0.3%.
“The impact of strikes and a pair of hurricanes likely disrupted manufacturing activity for a second straight month,” said ANZ economist Felix Ryan. “The Fed typically looks through supply-side disruptions when assessing economic activity.”
The figures came out on the same morning as the latest retail sales numbers and short-term US Treasury bond yields fell moderately while longer-term yields either finished steady or increased a touch. By the close of business, the 2-year Treasury yield had lost 5bps to 4.30%, the 10-year had returned to its starting point at 4.44% while the 30-year yield finished 1bp higher at 4.61%.
In terms of US Fed policy, expectations of a lower federal funds rate in the next 12 months firmed, with at least another two 25bp cuts priced in. At the close of business, contracts implied the effective federal funds rate would average 4.515% in December, 4.42% in January and 4.345% in February. October 2025 contracts implied 3.885%, 70bps less than the current rate.
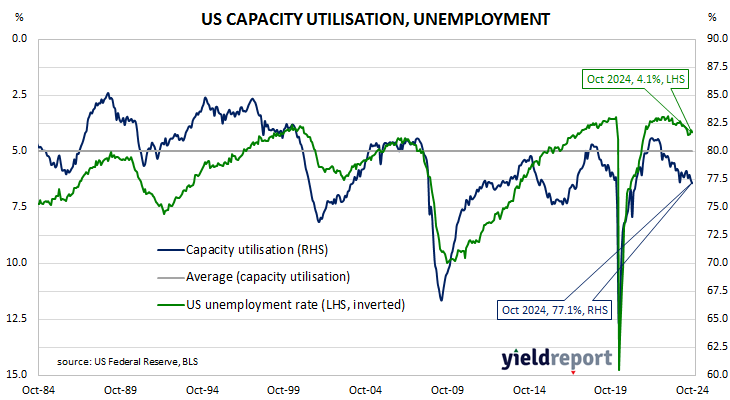
The same report includes capacity utilisation figures which are generally accepted as an indicator of future investment expenditure and/or inflationary pressures. Capacity usage hit a high for the last business cycle in early 2019 before it began a downtrend which ended with April 2020’s multi-decade low of 64.2%. October’s reading decreased by 0.3 percentage points after revisions to 77.1%, 3.0 percentage points below the long-term average.
While the US utilisation rate’s correlation with the US jobless rate is solid, it is not as high as the comparable correlation in Australia.