
Summary: ISM purchasing managers index retreats slightly; reading just below consensus expectation; “sharp fall in new orders”; manufacturing “improving” but “far from full recovery”; US economy growing at solid pace.
US purchasing managers’ index (PMI) readings reached a cyclical peak in September 2017 before they started a downtrend which stabilised in late 2019 after a truce of sorts was made with the Chinese regarding trade. March’s report signalled a contraction in US manufacturing activity had begun; it stayed in this state until June.
According to the latest Institute of Supply Management (ISM) survey, its Purchasing Managers Index recorded a reading of 55.4% in September. The result was slightly below the expected figure of 55.9% and lower than August’s reading of 56.0%. The average reading since 1948 is 52.9% and any reading above 50% implies an expansion in the manufacturing sector. A reading “above 42.8%, over a period of time, generally indicates an expansion of the overall economy,” according to the ISM.
“There was a sharp fall in new orders and production eased. Delivery times increased as did employment and inventories but these components tend to lag behind orders. All in all, manufacturing is improving but is still a long way from full recovery,” said ANZ economist Kishti Sen.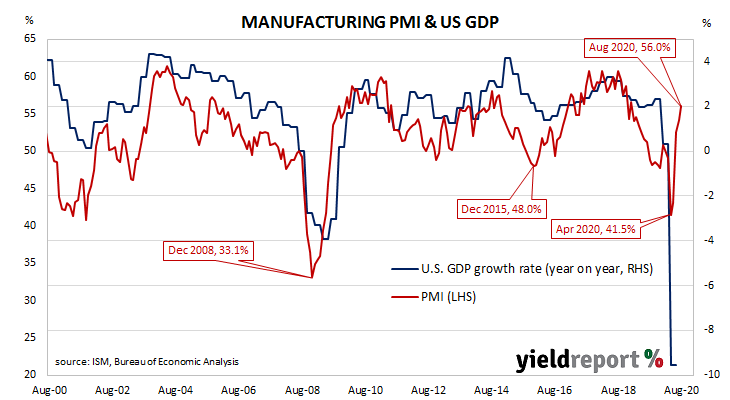
US Treasury bond yields reacted in a mixed fashion on the day. By the close of business, the 2-year Treasury bond yield had lost 2bps to 0.13%, the 10-year yield remained unchanged at 0.68% while the 30-year yield finished 1bp higher at 1.46%.
Purchasing Managers’ Indices (PMIs) are economic indicators derived from monthly surveys of executives in private-sector companies. They are diffusion indices, which means a reading of 50% represents no change from the previous period, while a reading under 50% implies respondents reported a deterioration on average. They are particularly useful as a leading indicator.
Manufacturing PMI figures appear to lead US GDP by several months despite a considerable error in any given month. The chart below shows US GDP on a “year on year” basis (and not the BEA annualised basis) against US GDP implied by monthly PMI figures.