
Summary: ISM PMI slightly down in July, above expectations; new order rates contracting, supplier deliveries improve, prices soften; sharp fall in price subindex “an encouraging sign”, pressures “may be easing”; latest reading implies 3.1% 12-month growth rate in December.
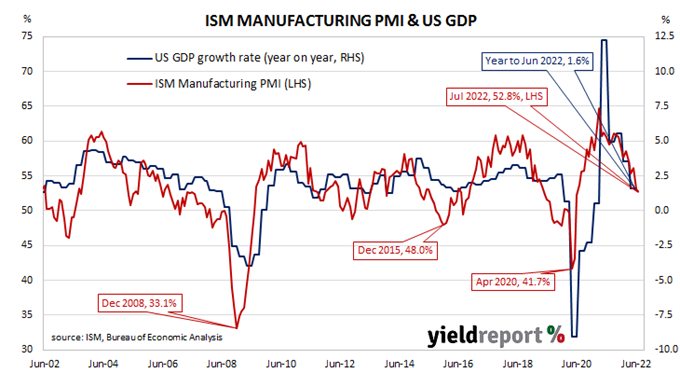
The Institute of Supply Management (ISM) manufacturing Purchasing Managers Index (PMI) reached a cyclical peak in September 2017. It then started a downtrend which ended in March 2020 with a contraction in US manufacturing which lasted until June 2020. Subsequent month’s readings implied growth had resumed, with the index becoming stronger through to March 2021. Since then, readings have remained at levels associated with economic growth despite some recent declines.
According to the ISM’s July survey, its PMI recorded a reading of 52.8%, above the generally expected figure of 52.1% but slightly lower than June’s 53.0%. The average reading since 1948 is 53.0% and any reading above 50% implies an expansion in the US manufacturing sector relative to the previous month.
“The US manufacturing sector continues expanding, though slightly less so in July, as new order rates continue to contract, supplier deliveries improve and prices soften to acceptable levels,” said Timothy Fiore, Chair of the ISM’s Manufacturing Business Survey Committee.
US Treasury yields fell on the day. By the close of business, the 2-year Treasury bond yield had lost 2bps to 2.86%, the 10-year yield had shed 8bps to 2.57% while the 30-year yield finished 9bps lower at 2.92%.
In terms of US Fed policy, expectations of higher federal funds rates over the next 12 months generally firmed a little. At the close of business, September contracts implied an effective federal funds rate of 2.51%, 18bps higher than the current spot rate while November contracts implied a rate of 3.16%. July 2023 futures contracts implied 3.045%, 72bps above the spot rate.
“It’s a reasonable print by historical standards but [it] reflects a sharp drop from the low 60s seen at the end of 2021 and the headline index is at a two-year low,” said ANZ Head of Australian Economics David Plank. He noted the sharp fall in the Prices subindex, stating it was “an encouraging sign that price pressures may be easing.”
Purchasing managers’ indices (PMIs) are economic indicators derived from monthly surveys of executives in private-sector companies. They are diffusion indices, which means a reading of 50% represents no change from the previous period, while a reading under 50% implies respondents reported a deterioration on average. A reading “above 48.7%, over a period of time, generally indicates an expansion of the overall economy” according to the ISM.
The ISM’s manufacturing PMI figures appear to lead US GDP by several months despite a considerable error in any given month. The chart below shows US GDP on a “year on year” basis (and not the BEA annualised basis) against US GDP implied by monthly PMI figures.
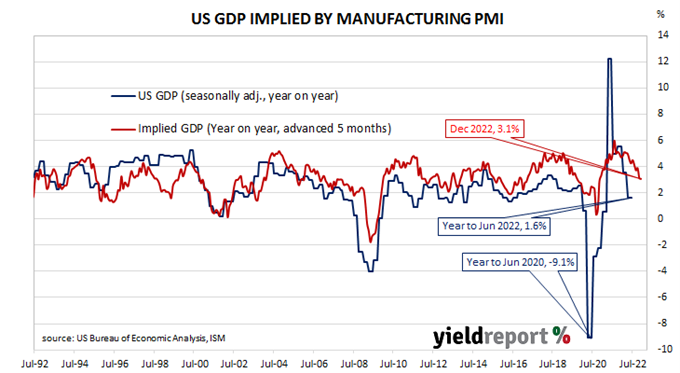
According to the ISM and its analysis of past relationships between the PMI and US GDP, July’s PMI corresponds to an annualised growth rate of 1.4%, or 0.4% over a quarter. Regression analysis on a year-on-year basis suggests a 12-month GDP growth rate of 3.1% five months after this latest report.
The ISM index is one of two monthly US PMIs, the other being an index published by IHS Markit. IHS Markit also produces a “flash” estimate in the last week of each month which comes out about a week before the ISM index is published. The IHS Markit July flash manufacturing PMI registered 52.3%, 0.4 percentage points lower than June’s final figure.