Summary: Non-farm payrolls up 236,000 in March, in line with expectations; previous two months’ figures revised down by 17,000; jobless rate down from 3.6% to 3.5%, participation rate up; labour market “solid”, challenges market pricing of rate cuts; employed-to-population ratio rises; underutilisation rate down; annual hourly pay growth slows.
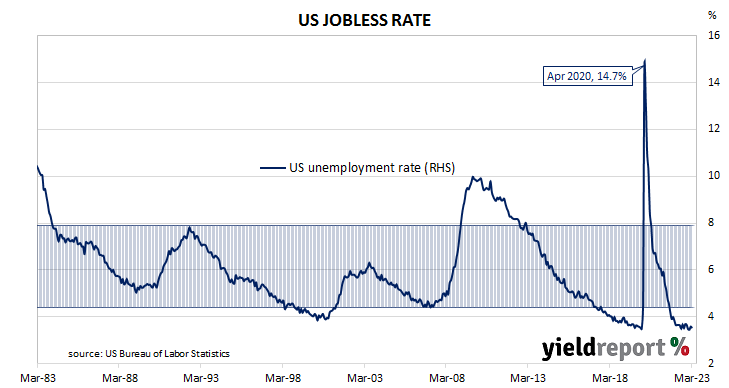
The US economy ceased producing jobs in net terms as infection controls began to be implemented in March 2020. The unemployment rate had been around 3.5% but that changed as job losses began to surge through March and April of 2020. The May 2020 non-farm employment report represented a turning point and subsequent months provided substantial employment gains. Changes in recent months have been generally more modest but still above the average of the last decade.
According to the US Bureau of Labor Statistics, the US economy created an additional 236,000 jobs in the non-farm sector in March. The increase was essentially in line with the 240,000 which had been generally expected but less than the 326,000 jobs which had been added in February after revisions. Employment figures for January and February were revised down by a total of 17,000.
The total number of unemployed decreased by 97,000 to 5.839 million while the total number of people who were either employed or looking for work increased by 480,000 to 166.731 million. These changes led to the US unemployment rate declining from February’s figure of 3.6% to 3.5% as the participation rate ticked up from 62.5% to 62.6%.
“The payrolls report was a reminder to investors that while employment growth may be slowing the labour market remains solid with the report challenging market pricing of imminent rate cuts,” said NAB Head of Markets Strategy Skye Masters.
US Treasury yields rose noticeably on the day. By the close of business, the 2-year yield had jumped 14bps to 3.96%, the 10-year yield had added 9bps to 3.40% while the 30-year yield finished 7bps higher at 3.62%.
In terms of US Fed policy, expectations of a higher federal funds rate over the next six months hardened while expectations of rate cuts further out softened. At the close of business, contracts implied the effective federal funds rate would average 4.825% in April, in line with the current spot rate, and then climb to an average of 4.985% in May. June futures contracts implied a 5.00% average effective federal funds rate while April 2024 contracts implied 3.94%.
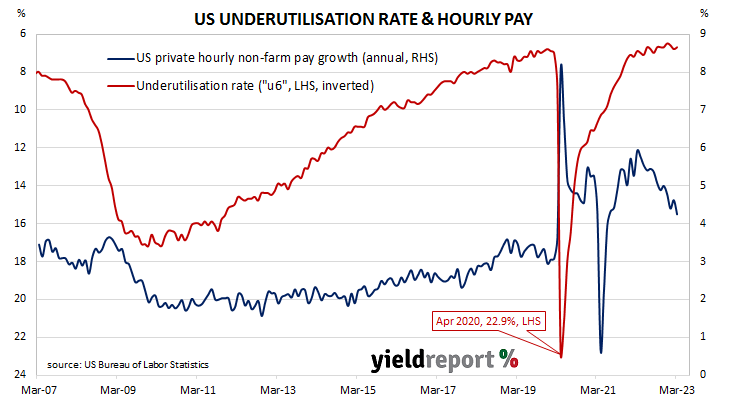
One figure which is indicative of the “spare capacity” of the US employment market is the employment-to-population ratio. This ratio is simply the number of people in work divided by the total US population. It hit a cyclical-low of 58.2 in October 2010 before slowly recovering to just above 61% in late-2019. March’s reading increased from 60.2% to 60.4%, still some way from the April 2000 peak reading of 64.7%.
Apart from the unemployment rate, another measure of tightness in the labour market is the underutilisation rate and the latest reading of it registered 6.7%, down from 6.8% in February. Wage inflation and the underutilisation rate usually have an inverse relationship, although hourly pay growth in the year to March slowed from 4.6% to 4.2%.