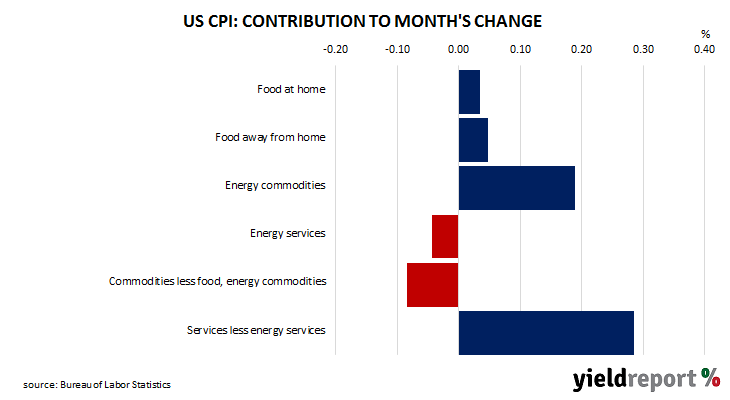
Summary: US CPI up 0.4% in October, less than expected; “core” rate up 0.3%; “some optimism” inflationary pulse starting to wane; “some moderation in services inflation”; Treasury yields fall significantly; rate-rise expectations soften; non-energy services again main driver, adds 0.29 ppts.
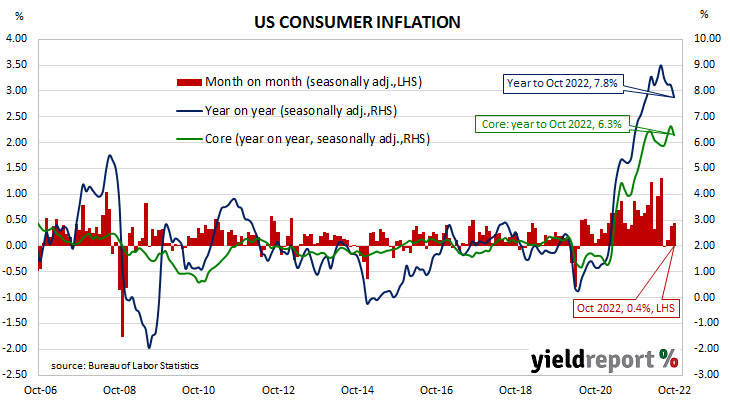
The annual rate of US inflation as measured by changes in the consumer price index (CPI) halved from nearly 3% in the period from July 2018 to February 2019. It then fluctuated in a range from 1.5% to 2.0% through 2019 before rising above 2.0% in the final months of that year. Substantially lower rates were reported from March 2020 to May 2020 and they remained below 2% until March 2021. Rates have since risen significantly.
The latest CPI figures released by the Bureau of Labor Statistics indicated seasonally-adjusted consumer prices increased by 0.4% on average in October. The result was well below the generally expected figure of 0.7% but in line with September’s increase. On a 12-month basis, the inflation rate slowed from 8.2% to 7.8%.
“Headline” inflation is known to be volatile and so references are often made to “core” inflation for analytical purposes. The core prices index, the index which excludes the more variable food and energy components, increased by 0.3% on a seasonally-adjusted basis for the month. The rise was less than the expected increase of 0.5% as well as the 0.6% increase in September and the annual growth rate slowed from 6.7% to 6.3%.
“Whilst the data allow some optimism that the inflationary pulse may be starting to wane, it is wise not to read too much into it,” said ANZ’s Head of G3 Economics Brian Martin. “The market was wrongfooted in the summer when July core inflation rose 0.3% only to roar back in August and September. A sequence of moderate prints is required to be confident that it is sustainably lower.”
US Treasury bond yields finished significantly lower on the day. By the close of business, the 2-year Treasury yield had shed 33bps to 4.32%, the 10-year yield had lost 28bps to 3.82% while the 30-year yield finished 20bps lower at 4.06%.
In terms of US Fed policy, expectations of higher federal funds rates over the next 12 months softened noticeably. At the close of business, contracts implied the effective federal funds rate would average 4.12% in December, 29bps higher than the current spot rate, and then climb to an average of 4.68% in February 2023. May 2023 futures contracts implied a 4.875% average effective federal funds rate while November 2023 contracts implied 4.535%.
“In more normal times the annualised numbers, 7.7% for headline and 5.4% for core, would hardly be cause for cheer, but these are not normal times,” said NAB senior interest rate strategist Ken Crompton. “The most notable trend in the detail is some moderation in services inflation, especially rents and health insurance.”
The largest influence on headline results is often the change in fuel prices. Prices of “Energy commodities”, the segment which contains vehicle fuels, increased by 4.4% and added 0.19 percentage points. However, prices of non-energy services, the segment which includes actual and implied rents, again had the largest effect on the total, adding 0.29 percentage points after increasing by 0.5% on average.