Summary: US industrial output down 0.3% in September, fall greater than expected; down 0.6% over past 12 months; Citi: fall expected as aerospace strike, hurricanes hit; US Treasury yields up; rate-cut expectations soften; capacity utilisation rate falls to 77.5%, below long-term average.
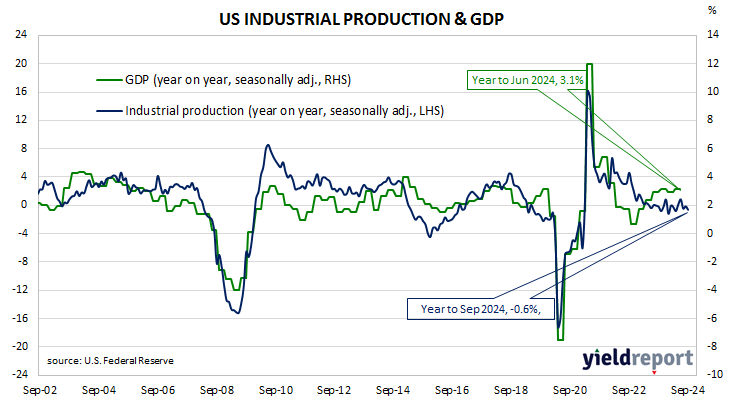
The Federal Reserve’s industrial production (IP) index measures real output from manufacturing, mining, electricity and gas company facilities located in the United States. These sectors are thought to be sensitive to consumer demand and so some leading indicators of GDP use industrial production figures as a component. US production collapsed through March and April of 2020 before recovering the ground lost over the fifteen months to July 2021. However, production levels has largely stagnated since early 2022.
According to the Federal Reserve, US industrial production decreased by 0.3% on a seasonally adjusted basis in September. The fall was a larger one than the 0.1% contraction which had been generally expected and a reversal of August’s downwardly-revised 0.3% expansion. The annual contraction rate accelerated from August’s downwardly revised figure of 0.2% to 0.6%.
“The decline in industrial production was well expected given disruptions caused by a strike in the aerospace industry and by hurricanes,” said Citi analyst Alice Zheng. “The Fed estimates IP would have grown 0.3% without these events, which is somewhat surprising given weaker survey data and other manufacturing data like hours worked.”
The figures came out on the same morning as the latest retail sales numbers and US Treasury bond yields rose across a steeper curve. By the close of business, the 2-year Treasury yield had gained 4bps to 3.98%, the 10-year had increased by 8bps to 4.10% while the 30-year yield finished 6bps higher at 4.36%.
In terms of US Fed policy, expectations of a lower federal funds rate in the next 12 months softened, although at least another five 25bp cuts priced in. At the close of business, contracts implied the effective federal funds rate would average 4.655% in November, 18bps less the current rate, 4.515% in December and 4.22% in February. September 2025 contracts implied 3.515%, 131bps less than the current rate.
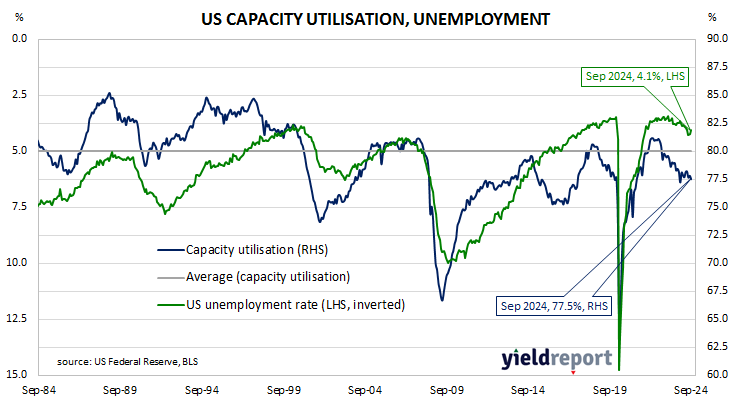
The same report includes capacity utilisation figures which are generally accepted as an indicator of future investment expenditure and/or inflationary pressures. Capacity usage hit a high for the last business cycle in early 2019 before it began a downtrend which ended with April 2020’s multi-decade low of 64.2%. September’s reading declined by 0.3 percentage points after revisions to 77.5%, 2.6 percentage points below the long-term average.
While the US utilisation rate’s correlation with the US jobless rate is solid, it is not as high as the comparable correlation in Australia.