Summary: US CPI up 0.2% in July, as expected; “core” rate up 0.2%; ANZ: core services inflation still sticky; Treasury yields rise; rate-cut expectations unchanged; NAB: super core” measures show “little tick-up”; non-energy services prices again main driver, adds 0.23 ppts.
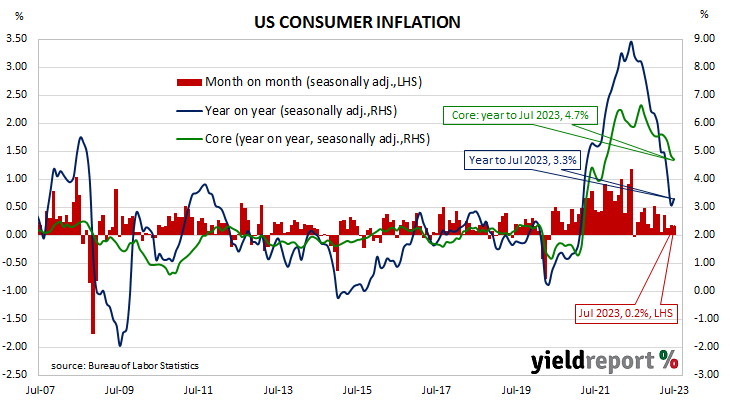
The annual rate of US inflation as measured by changes in the consumer price index (CPI) halved from nearly 3% in the period from July 2018 to February 2019. It then fluctuated in a range from 1.5% to 2.0% through 2019 before rising above 2.0% in the final months of that year. Substantially lower rates were reported from March 2020 to May 2020 and they remained below 2% until March 2021. Rates have since risen significantly, although they have been declining since mid-2022.
The latest US CPI figures released by the Bureau of Labor Statistics indicated seasonally-adjusted consumer prices increased by 0.2% on average in July. The result was in line with expectations as well as June’s rise. However, on a 12-month basis, the inflation rate accelerated from 3.1% to 3.3%.
“Headline” inflation is known to be volatile and so references are often made to “core” inflation for analytical purposes. The core prices index, the index which excludes the more variable food and energy components, also increased by 0.2% on a seasonally-adjusted basis over the month, as expected. The annual growth rate slowed from 4.9% to 4.7%.
“All up, the July CPI report will likely be welcomed by the Fed,” said ANZ Head of FX Research Mahjabeen Zaman. “The slower pace of core inflation over the past two months is positive but core services inflation still looks sticky.”
US Treasury bond yields rose on the day, especially at the long end. By the close of business, the 2-year Treasury yield had added 3bps to 4.83%, the 10-year yield had gained 10bps to 4.11% while the 30-year yield finished 8bps higher at 4.25%.
In terms of US Fed policy, expectations of a lower federal funds rate in the first half of 2024 remained pretty stable. At the close of business, contracts implied the effective federal funds rate would average 5.335% in September, slightly above the current spot rate, and then increase to an average of 5.355% in October. December futures contracts implied a 5.39% average effective federal funds rate while August 2024 contracts implied 4.615%, 72bps less than the current rate.
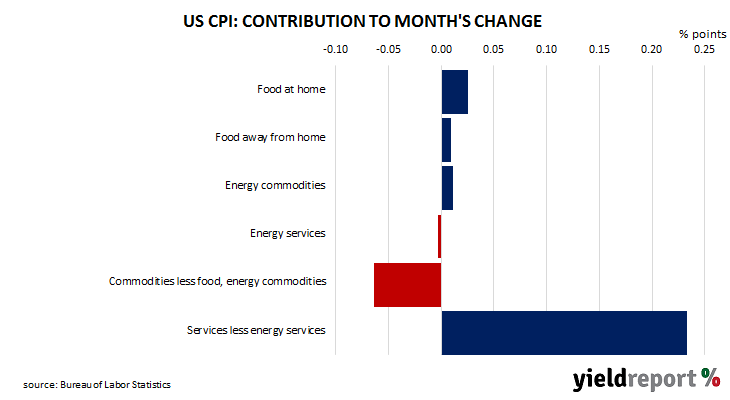
“Although some of the more tightly defined “super core” measures showed a little tick-up in price growth relative to prior months, the print has been widely received as giving the FOMC leeway to stay on hold at its September meeting,” said NAB senior interest-rate strategist Ken Crompton. The largest influence on headline results is often the change in fuel prices.
Prices of “Energy commodities”, the segment which contains vehicle fuels, increased by 0.3% and contributed 0.01 percentage points to the total. However, prices of non-energy services, the segment which includes actual and implied rents, again had the largest effect on the total, adding 0.23 percentage points after increasing by 0.4% on average.
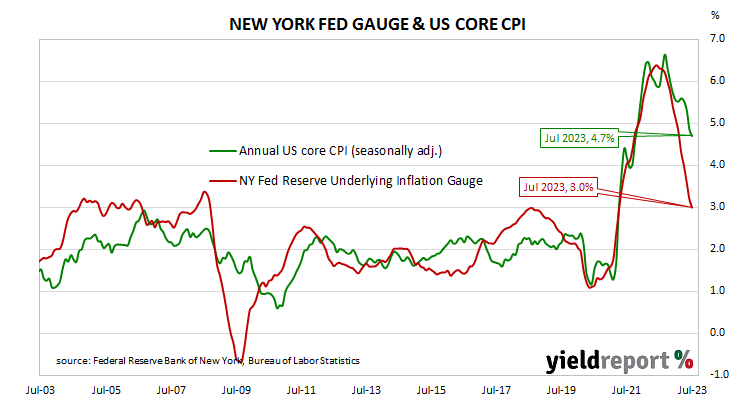
The Federal Reserve Bank of New York publishes an unofficial estimate of underlying inflation, known as the Underlying Inflation Gauge (UIG) and it was updated shortly after these latest CPI figures. While the Federal Reserve states the UIG does not represent an official estimate, the UIG does appear to lead the core CPI measure. July’s UIG registered an annual rate of 3.0%, down from June’s figure of 3.2%.