
The annual rate of US inflation as measured by changes in the consumer price index (CPI) halved from nearly 3% in the period from July 2018 to February 2019. It then fluctuated in a range from 1.5% to 2.0% through 2019 before rising above 2.0% in the final months of that year. “Headline” inflation is known to be volatile and so references are often made to “core” inflation for analytical purposes. This measure has mostly ranged between 1.7% and 2.3% in recent years. Lower figures are now expected from both measures as 2020 unfolds.
The latest CPI figures released by the Bureau of Labor Statistics indicated seasonally-adjusted consumer prices decreased by 0.4% on average in March, a lower figure than the 0.3% fall which had been expected and a reversal from February’s +0.1%. On a 12-month basis, the inflation rate slowed from February’s annual rate of 2.3% to 1.5%.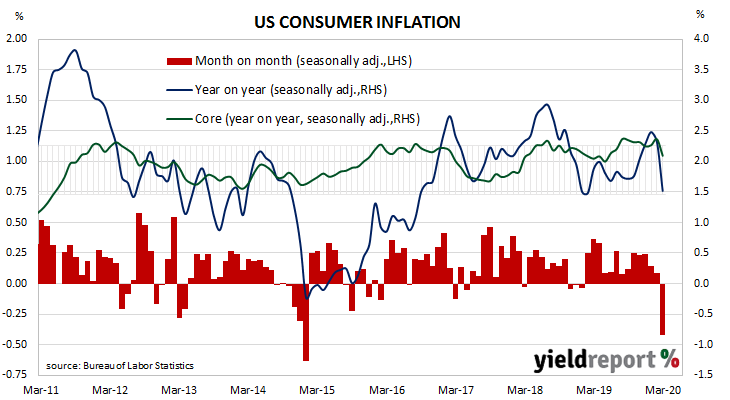 Core inflation, a measure of inflation which strips out the volatile food and energy components of the index, decreased on a seasonally-adjusted basis by 0.1% for the month, below the +0.1% increase which had been generally expected and less than February’s +0.2% increase. The annual rate slowed from February’s 2.4% to 2.1% in March.
A month ago, ANZ FX strategist John Bromhead had said “a potentially large deflationary shock hangs over us.” After the latest figures were released, NAB Head of FX Strategy Ray Attrill firmed up this view. “Notwithstanding all manner of measurement challenges with inflation data, given some services simply aren’t being produced…the US numbers are telling us that, for now, the pandemic is a disinflationary, if not outright deflationary, economic force.”
US Treasury bond markets were closed. 2-year, 10-year and 30-year Treasury yields remained unchanged at 0.22%, 0.73% and 1.22% respectively.