
The headline inflation rate came in at 0.4%, a rise from the March figure of 0.1% and in line with the 0.4% rise expected. Energy prices were substantially responsible for the index’s rise, with petrol jumping 8.1% over the month. Clothes, vehicles and non-energy commodities fell. The year-to-date CPI figure rose to 1.1% from 0.9%, and it is now back above February’s comparable figure of 1.0%.
Core inflation, which was seen as a long-run measure of price increases across the economy, continued to edge down. The annual rate hit a short-term peak at 2.3% in February before slipping to 2.2% in March and then 2.1% in April. Core inflation strips out the more volatile food and energy components.
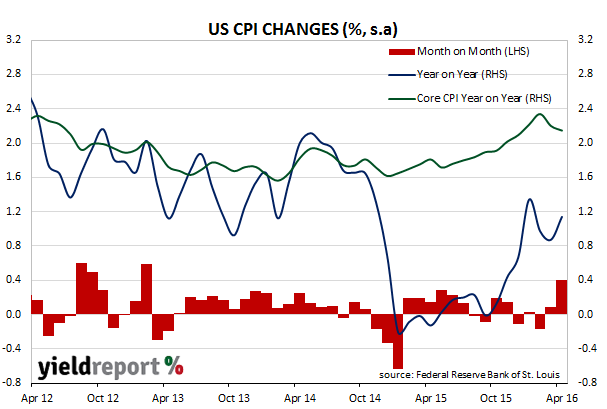
ANZ did not have much to say about the results other than to note “the core measure of inflation (which covers 80% of the CPI) has now been at 2% or higher for six months” while Westpac said, “US CPI, industrial production, capacity utilisation and house building all beat estimates.” NAB took a different tack and looked at the implications for the personal consumption expenditure figure (PCE). “On an annual basis, core CPI dipped to 2.1% from 2.2% in March and it would suggest there is downside risk to the core PCE deflator (the Fed preferred inflation measure) due for release on the last day in May. “
The CPI figures, along with statements from FOMC members Williams and Lockhart alluding to the next few meetings being ”live”, sent treasury yields higher. 2 year bond yields rose from 0.79% to 0.83% and 10 year bond yields rose from 1.75% to 1.77%.