The US Commerce Department released the Q3 GDP “advanced” estimates which showed an annualised growth rate of 1.5%, lower than the consensus estimate of 1.7% and lower than the Q2 figure of 3.9%. Despite the lower than expected figures, US 2 year Treasury notes reacted by moving up 2bps to 0.75% while US 10 year bonds moved 9bps higher to 2.19%.
The fall in the growth rate in the third quarter was the primarily due to businesses drawing down on inventory stocks but according to the Commerce Department all sectors of the economy acted as a drag on the overall growth rate.
Westpac described the result as indicating an economy that was healthy, noting the final sales figure grew 3% which, while not a strong as the 3.9% for the comparable figure in Q2, was in their view still “decent”. ANZ referred to the “robust” domestic demand and said the results were consistent with the Fed’s description of the growth rates as being “solid”.
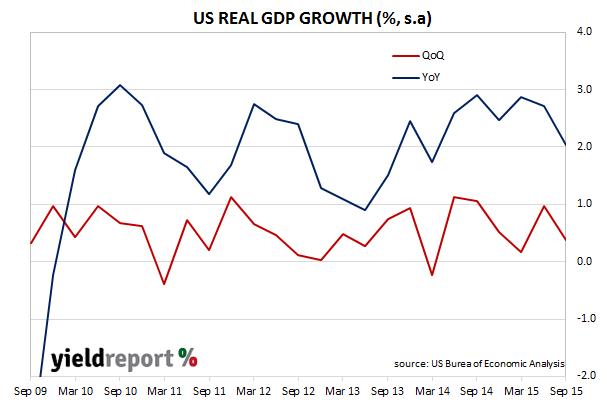
The Commerce Department calculates the annualised figure by compounding the quarterly result and so a direct comparison with UK or Australian figures is not meaningful. However, if the US GDP growth figures were to be calculated in same way Australia does (that is, q/q and y/y), then the quarterly US GDP figure would be 0.4% s.a. (previously 1.0% s.a.) and the year-on-year figure would be 2.0% s.a. (previously 2.7% s.a.).