US industrial output down 0.5% in June, below expectations; down 0.4% over past 12 months; NAB: nothing new, figures confirm well-known weakness in US manufacturing; Treasury yields rise at short end, fall elsewhere; rate-cut expectations soften; capacity utilisation rate down 0.5ppts to 78.9%, further below long-term average.
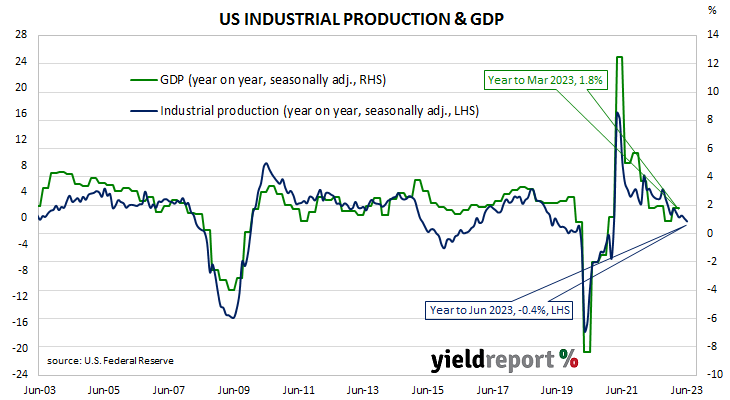
The Federal Reserve’s industrial production (IP) index measures real output from manufacturing, mining, electricity and gas company facilities located in the United States. These sectors are thought to be sensitive to consumer demand and so some leading indicators of GDP use industrial production figures as a component. US production collapsed through March and April of 2020 before recovering the ground lost over the fifteen months to July 2021.
According to the Federal Reserve, US industrial production decreased by 0.5% on a seasonally adjusted basis in June. The contraction contrasted with the flat outcome which had been generally expected and it was in line with the 0.5% contraction in May after revisions. On an annual basis the growth rate slowed from May’s revised figure of 0.0% to -0.4%.
“Not much to see there given already well-known weakness in the manufacturing sector which doesn’t appear to be spilling over to the services side,” said NAB Head of Market Economics Tapas Strickland.
The figures came out the same morning as the latest retail sales figures and shorter-term US Treasury bond yields increased while longer-terms yields declined. By the close of business, the 2-year Treasury yield had added 2bps to 4.76%, the 10-year yield had lost 2bps to 3.79% while the 30-year yield finished 3bps lower at 3.90%.
In terms of US Fed policy, expectations of a lower federal funds rate in the first half of 2024 softened slightly. At the close of business, contracts implied the effective federal funds rate would average 5.12% in July, 4bps more than the current spot rate, and then increase to an average of 5.315% in August. December futures contracts implied a 5.37% average effective federal funds rate while June 2024 contracts implied 4.75%, 33bps less than the current rate.
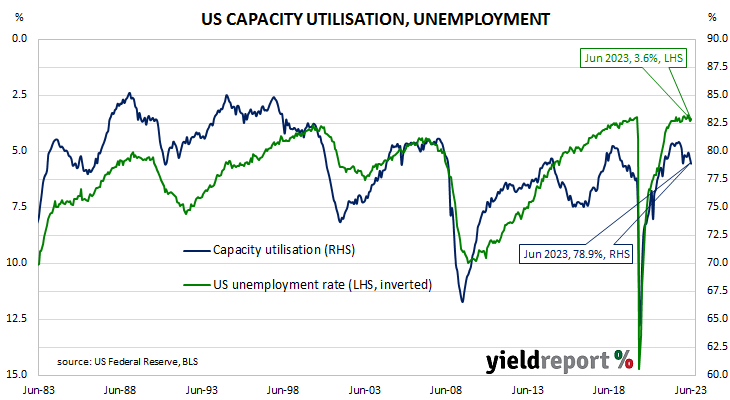
The same report includes US capacity utilisation figures which are generally accepted as an indicator of future investment expenditure and/or inflationary pressures. Capacity usage had hit a high for the last business cycle in early 2019 before it began a downtrend which ended with April 2020’s multi-decade low of 64.2%. June’s reading decreased from May’s revised figure of 79.4% to 78.9%, a little further below the long-term average of 80.1%.
While the US utilisation rate’s correlation with the US jobless rate is solid, it is not as high as the comparable correlation in Australia.