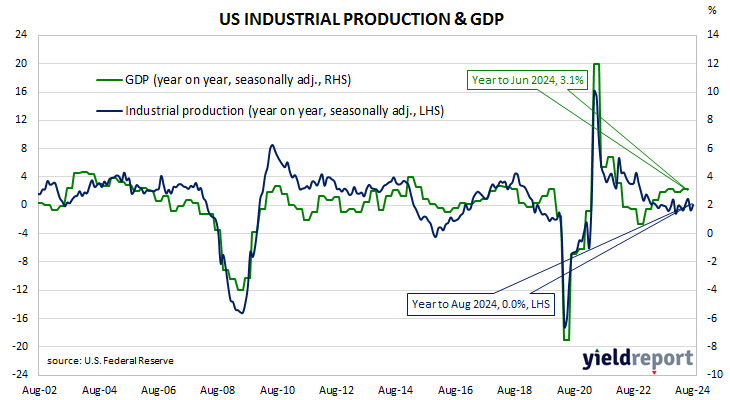
Summary: US industrial output up 0.8% in August, greater than expected; zero growth over past 12 months; ANZ: suggests solid growth in Q3, no evidence of a recession; US Treasury yields up; rate-cut expectations soften slightly; capacity utilisation rate rises to 78.0%.
The Federal Reserve’s industrial production (IP) index measures real output from manufacturing, mining, electricity and gas company facilities located in the United States. These sectors are thought to be sensitive to consumer demand and so some leading indicators of GDP use industrial production figures as a component. US production collapsed through March and April of 2020 before recovering the ground lost over the fifteen months to July 2021. However, production levels has largely stagnated since early 2022.
According to the Federal Reserve, US industrial production increased by 0.8% on a seasonally adjusted basis in August. The rise was significantly greater than the 0.1% expansion which had been generally expected and a near-total reversal of July’s downwardly-revised 0.9% contraction. The annual growth rate moved back to zero, up from July’s downwardly revised figure of -0.7%.
“August motor vehicle production jumped nearly 10.0% following a 9.0% decline in July,” said ANZ economist Sophia Angala. “Ex-motor vehicles, manufacturing production rose 0.3%. Both sets of data are suggesting solid growth in Q3 and no evidence of a recession.
The figures came out on the same morning as the latest retail sales numbers and short-term US Treasury bond yields increased noticeably on the day while longer-term yields rose more moderately. By the close of business, the 2-year Treasury yield had gained 6bps to 3.61% while 10-year and 30-year yield both finished 3bps higher at 3.65% and 3.96% respectively..
In terms of US Fed policy, expectations of a lower federal funds rate in the next 12 months softened slightly, although at least nine 25bp cuts are still factored in. At the close of business, contracts implied the effective federal funds rate would average 5.17% in September, 4.64% in November and 4.40% in December. August 2025 contracts implied 2.965%, 236bps less than the current rate.
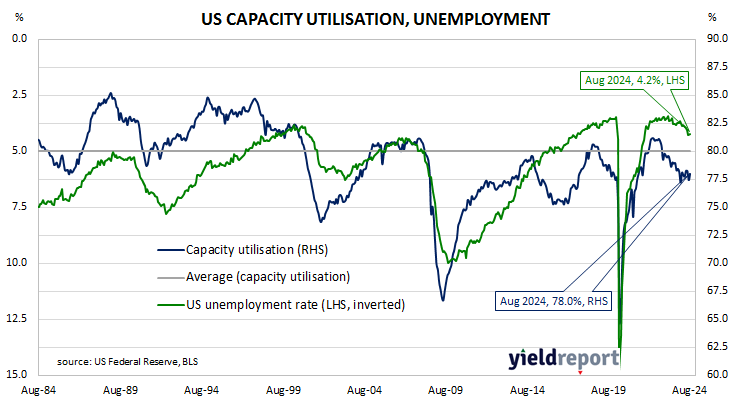
The same report includes capacity utilisation figures which are generally accepted as an indicator of future investment expenditure and/or inflationary pressures. Capacity usage hit a high for the last business cycle in early 2019 before it began a downtrend which ended with April 2020’s multi-decade low of 64.2%. August’s reading increased by 0.6 percentage points after revisions to 78.0%, 2.1 percentage points below the long-term average.
While the US utilisation rate’s correlation with the US jobless rate is solid, it is not as high as the comparable correlation in Australia.