US industrial output up 0.2% in November, in line with expectations; down 0.4% over past 12 months; manufacturing output up following resolution of car maker strikes; short-term Treasury yields rise, longer-term yields decline; rate-cut expectations soften; capacity utilisation rate up 0.1ppts to 78.8%, below long-term average.
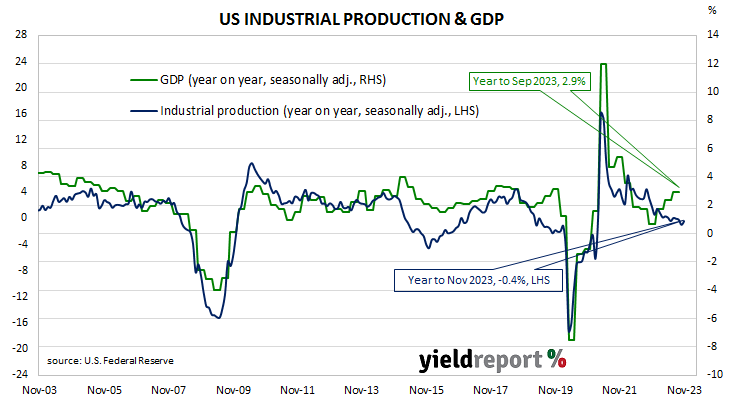
The Federal Reserve’s industrial production (IP) index measures real output from manufacturing, mining, electricity and gas company facilities located in the United States. These sectors are thought to be sensitive to consumer demand and so some leading indicators of GDP use industrial production figures as a component. US production collapsed through March and April of 2020 before recovering the ground lost over the fifteen months to July 2021.
According to the Federal Reserve, US industrial production expanded by 0.2% on a seasonally adjusted basis in November. The result was in line with expectations and in contrast with October’s 0.9% contraction after it was revised down from -0.6%. On an annual basis the contraction rate slowed from October’s revised figure of -1.0% to -0.4%.
“The increase in manufacturing output was more than accounted for by a 7.1% bounce-back in motor vehicles and parts production following the resolution of strikes at several major automakers.”
Short-term US Treasury yields rose on the day while longer-term yields declined. By the close of business, the 2-year Treasury yield had added 6bps to 4.45%, the 10-year yield had slipped 1bp to 3.91% while the 30-year yield finished 3bps lower at 4.01%.
In terms of US Fed policy, expectations of a lower federal funds rate in the next 12 months softened. At the close of business, contracts implied the effective federal funds rate would average 5.33% in January, in line with the current spot rate, 5.245% in March and 4.935% in May. December 2024 contracts implied 4.02%, 131bps less than the current rate.
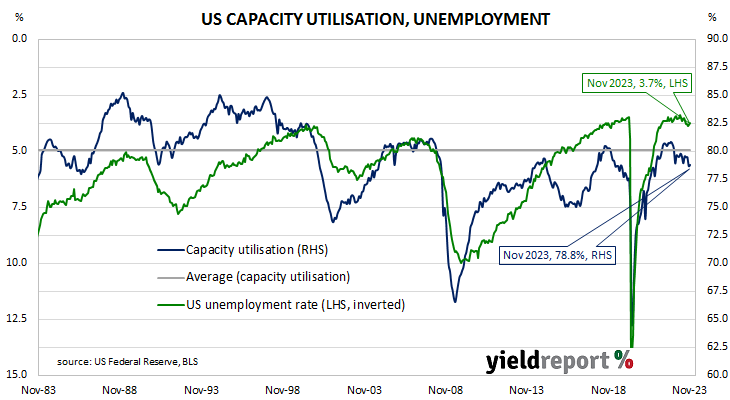
The same report includes US capacity utilisation figures which are generally accepted as an indicator of future investment expenditure and/or inflationary pressures. Capacity usage had hit a high for the last business cycle in early 2019 before it began a downtrend which ended with April 2020’s multi-decade low of 64.2%. November’s reading increased from October’s downwardly-revised figure of 78.7% to 78.8%, below the long-term average of 80.1%.
While the US utilisation rate’s correlation with the US jobless rate is solid, it is not as high as the comparable correlation in Australia.