
Summary: US producer price index (PPI) up 0.8% in February, less than 1.0% expected; annual rate unchanged at 10.1%; “core” PPI up 0.2%.
Around the end of 2018, the annual inflation rate of the US producer price index (PPI) began a downtrend which continued through 2019. Months in which producer prices increased suggested the trend may have been coming to an end, only for it to continue, culminating in a plunge in April 2020. Figures returned to “normal” towards the end of that year but recent months’ annual rates have been well above the long-term average.
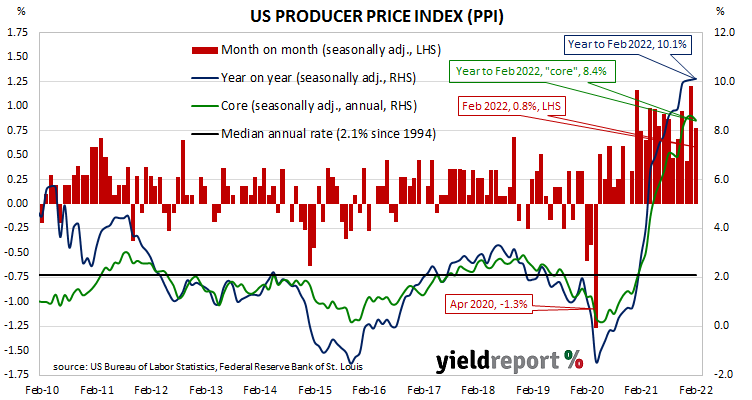
The latest figures published by the Bureau of Labor Statistics indicate producer prices rose by 0.8% after seasonal adjustments in February. The increase was less than the 1.0% rise which had been generally expected and lower than January’s revised figure of 1.2%. On a 12-month basis, the rate of producer price inflation after seasonal adjustments remained unchanged from January’s revised rate of 10.1%.
Producer prices excluding foods and energy, or “core” PPI, rose by just 0.2% after seasonal adjustments. The increase was less than the 0.6% which had been generally expected and substantially lower than January’s revised figure of 1.0%. The annual rate slowed from January’s revised rate of 8.6% to 8.4%.
US Treasury bond yields reacted in a mixed fashion on the day. By the close of business, the 2-year Treasury yield had slipped 1bp to 1.86%, the 10-year yield had gained 3bps to 2.15% while the 30-year yield finished unchanged at 2.48%.
In terms of US Fed policy, expectations for a higher federal funds rate over the next 12 months firmed a little. At the close of business, March contracts implied an effective federal funds rate of 0.215%, 14bps higher than the current spot rate. June contracts implied 0.905% while March 2023 futures contracts implied an effective federal funds rate of 2.03%, 195bps above the spot rate.
The producer price index is a measure of prices received by producers for domestically produced goods, services and construction. It is put together in a fashion similar to the consumer price index (CPI) except it measures prices received from the producer’s perspective rather than from the perspective of a retailer or a consumer. It is another one of the various measures of inflation tracked by the US Fed, along with core personal consumption expenditure (PCE) price data.