
The US Commerce Department released Q1 “advanced” estimates of US GDP, which is the first of four estimates and subject to three more revisions over the next two months. They showed an annualised growth rate of 0.5%, lower than the consensus estimate of 0.7% and lower than the Q4 2016 figure of 1.4%. The yields of US 2 year Treasury notes reacted by moving down 2bps to 0.79% while US 10 year bond yields edged down 1bp to 1.82%.
According to Commerce Department annualised data, consumers and government expenditures grew while net exports and investment shrank. Personal consumption expenditure (PCE) was up 1.9%, government expenditure was up 1.2%, investment was down 1.9%, exports were down 2.6% and imports up 0.2%.
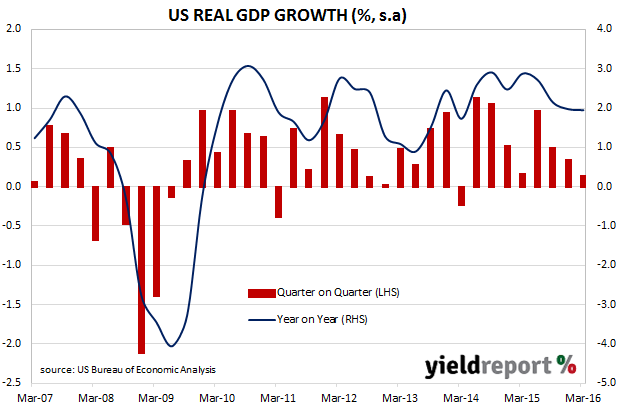
The Commerce Department calculates the annualised figure by compounding the quarterly result and so a direct comparison with UK or Australian figures is not meaningful. However, if the US GDP growth figures were to be calculated in same way as Australia (that is, q/q and y/y), then the quarterly US GDP figure would be 0.1% s.a. (previously 0.3% s.a.) and the year-on-year figure would be 1.9% s.a. (previously 2.0% s.a.).
Local banks were generally positive in their interpretations of the figures. Westpac noted how investment was the biggest drag on the growth figures but noted inventory reduction had occurred for three successive quarters in a row and were unlikely to continue. NAB was quick to point to the stronger-than-expected core PCE figures which are known to be watched closely by the US Fed while ANZ pointed to the weekly jobless data which they think “suggest[s] the labour market remains firm.”
ANZ summed up the banks’ attitude with the following comment. ”While the data certainly sends a clear signal that the US economy is in the midst of a soft patch, it arguably adds little to the FOMC’s assessment yesterday that the economy has slowed.”