
Summary: US output increases for third consecutive month; gain higher than expected; capacity utilisation increases but still at GFC levels.
The Federal Reserve’s industrial production (IP) index measures real output from manufacturing, mining, electricity and gas company facilities located in the United States. These sectors are thought to be sensitive to consumer demand and so some leading indicators of GDP use industrial production figures as a component.
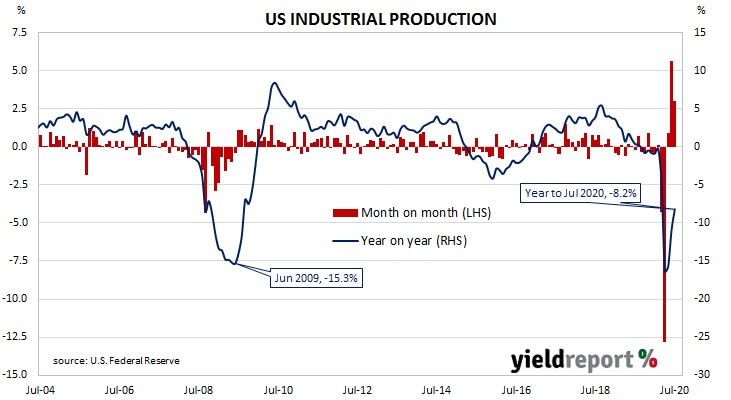
Production began to recover in May after a collapse which took place through March and April.
According to July’s figures, US industrial production expanded by 3.0% on a seasonally adjusted basis, the third consecutive monthly increase. The result was greater than the 2.7% expansion which had been expected but half that of June’s 5.4%. On an annual basis, the growth rate increased from June’s revised figure of -11.0% to -8.2%.
The report was released on the same day as July’s retail sales figures and the University of Michigan’s latest consumer sentiment report. US Treasury bond yields moved lower except at the ultra-long end where they increased a little. By the end of the day; the US 2-year Treasury yield had shed 3bps to 0.15%, the 10-year yield had slipped 1bp to 0.71% while the 30-year yield finished 2bps higher at 1.45%.
The same report includes US capacity utilisation figures which are generally accepted as an indicator of future investment expenditure and/or inflationary pressures. Capacity usage had hit a high for this business cycle in early 2019 before it began a downtrend which ended with April’s multi-decade low of 64.2%. July’s reading extended on the previous month’s recovery; capacity utilisation increased from June’s revised figure of 68.5% to 70.6%.