Summary: US industrial output up 0.9% in December, greater than expected; up 0.5% over past 12 months; ANZ: boosted by recovery in utilities output, end to Boeing strike; short-term US Treasury yields rise, longer-term yields hardly moved; rate-cut expectations soften; capacity utilisation rate rises to 77.6%, below long-term average.
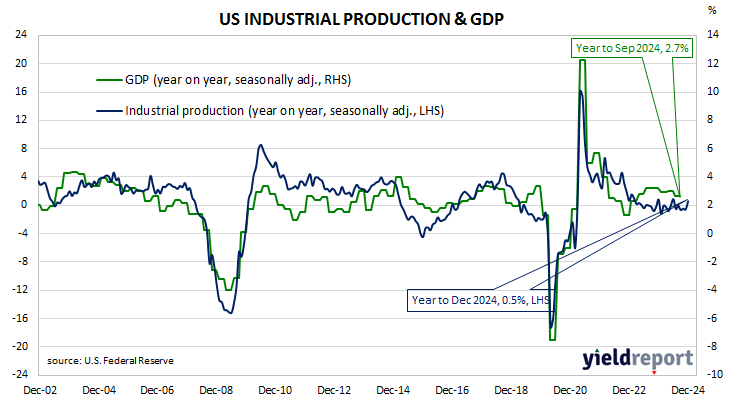
The Federal Reserve’s industrial production (IP) index measures real output from manufacturing, mining, electricity and gas company facilities located in the United States. These sectors are thought to be sensitive to consumer demand and so some leading indicators of GDP use industrial production figures as a component. US production collapsed through March and April of 2020 before recovering the ground lost over the fifteen months to July 2021. However, production levels has largely stagnated since early 2022.
According to the Federal Reserve, US industrial production rose by 0.9% on a seasonally adjusted basis in December. The rise was greater than the 0.3% increase which had been generally expected and in contrast with November’s 0.2% contraction. On an annual basis, the annual growth moved back into positive territory, rising from -0.6% to 0.5%.
“The data were helped by a recovery in utilities output and an end to the Boeing strike . All sectors of non-durable manufacturing rose,” said ANZ economist Madeline Dunk.
Short-term US Treasury bond yields rose moderately while longer-term yields hardly moved. By the close of business, the 2-year Treasury yield had gained 5bps to 4.29%, the 10-year had added 1bp to 4.63% while the 30-year yield finished unchanged at 4.86%.
In terms of US Fed policy, expectations of a lower federal funds rate in the next 12 months softened slightly, with one 25bp cut and a solid chance of another currently priced in. At the close of business, contracts implied the effective federal funds rate would average 4.325% in February, 4.30% in March and 4.26% in April. December contracts implied 3.955%, 37bps less than the current rate.
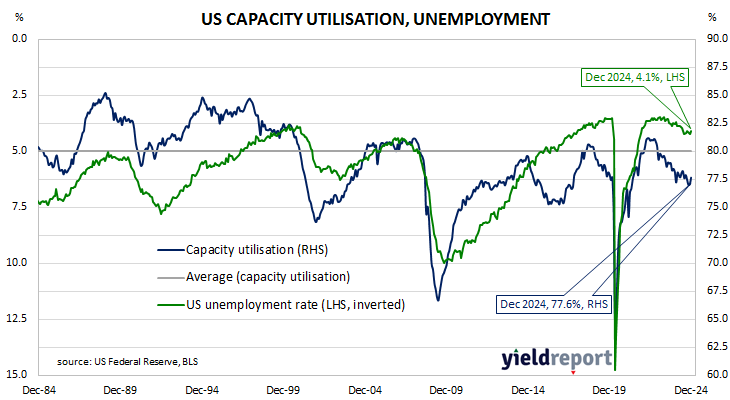
The same report includes capacity utilisation figures which are generally accepted as an indicator of future investment expenditure and/or inflationary pressures. Capacity usage hit a high for the last business cycle in early 2019 before it began a downtrend which ended with April 2020’s multi-decade low of 64.2%. December’s reading increased by 0.6 percentage points after revisions to 77.6%, 2.4 percentage points below the long-term average.
While the US utilisation rate’s correlation with the US jobless rate is solid, it is not as high as the comparable correlation in Australia.