
Summary: Leading index growth rate down in June; index capturing “very early impact” of rate tightening; reading implies annual GDP growth of around 3.15%.
Westpac and the Melbourne Institute describe their Leading Index as a composite measure which attempts to estimate the likely pace of Australian economic growth in the short-term. After reaching a peak in early 2018, the index trended lower through 2018 and 2019 before plunging to recessionary levels in the second quarter of 2020. Subsequent readings were markedly higher but readings through 2021 mostly declined.
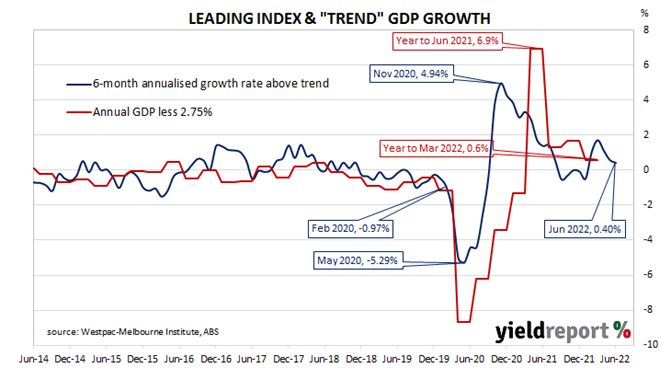
The June reading of the six month annualised growth rate of the indicator registered 0.40%, down from May’s revised figure of 0.56%.
“The June Index is capturing the very early impact of central bank tightening cycles,” said Westpac Chief Economist Bill Evans. “As the Reserve Bank extends and accelerates the pace of its tightening cycle, we can expect the growth rate in the Index to continue to ease.”
Index figures represent rates relative to “trend” GDP growth, which is generally thought to be around 2.75% per annum in Australia. The index is said to lead GDP by “three to nine months into the future” but the highest correlation between the index and actual GDP figures occurs with a three-month lead. The current reading thus represents an annual GDP growth rate of around 3.15% at the end of the September quarter.
Domestic Treasury bond yields moved higher on the day. By the close of business, 3-year and 10-year ACGB yields had both gained 4bps to 3.35% and 3.59% respectively while the 20-year yield finished 2bps higher at 3.80%.
In the cash futures market, expectations for a steeper path of the actual cash rate over time hardened. At the end of the day, contracts implied the cash rate would rise from the current rate of 1.31% to 1.89% in August and then increase to 3.28% by November. February contracts implied a 3.775% cash rate while May 2023 contracts implied 3.76%.