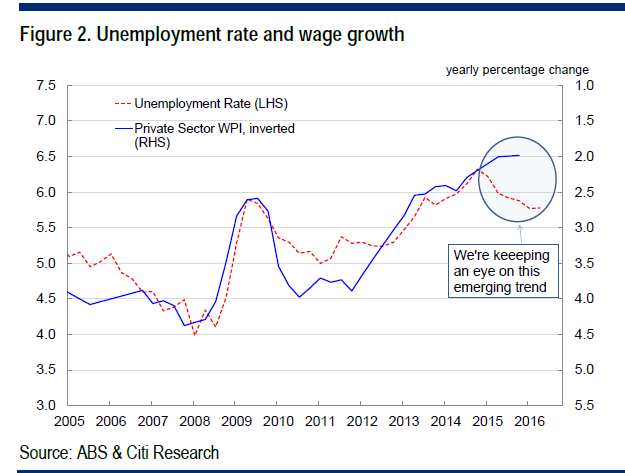
YieldReport loves a good chart where two separate economic variables line up with each other, thereby illustrating a firm relationship between the two. After the release of wage inflation figures, Citi Research put together a chart of the unemployment rate against private sector hourly wage inflation. Citi thinks there’s a good fit between the two or, for the technically minded, a high correlation and their chart seems to indicate this. Recently the unemployment rate has fallen (red line below), diverging from private sector wage inflation (blue line) and as citi notes in their chart, they are keeping “an eye on this emerging trend”.
Wage inflation is important in developed economies as a major cost component for businesses is the wages and salaries bill. Wages growth will either cut profit margins or lead to price rises or a combination of both. Inflation is defined as a general rise in prices so higher wages may lead to inflation in the absence of productivity gains. Central banks, including the RBA, are currently obsessed with raising inflation and so any early indicator of future inflation is of interest and perhaps that’s why Citi thought the relationship between unemployment and private sector wages growth worth studying.
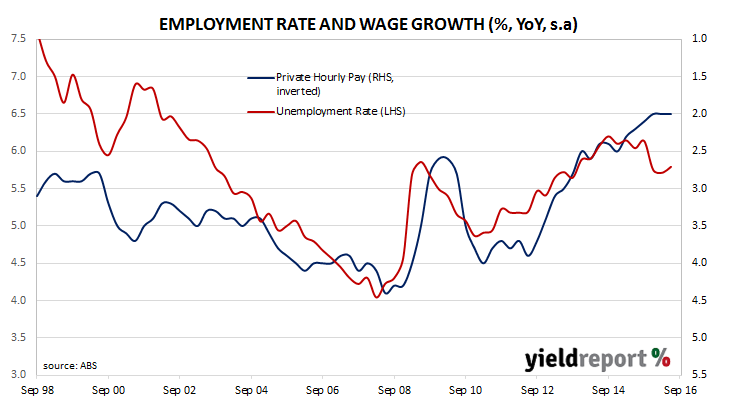
YieldReport thought it may be interesting to look a bit further back to when the hourly rate of pay survey was first introduced in 1998 and this is what it looks like: