Summary: US industrial output flat in January, below expectations; up 0.8% over past 12 months; reduced demand for heating; capacity utilisation rate down 0.1ppts to 78.3%, below long-term average.
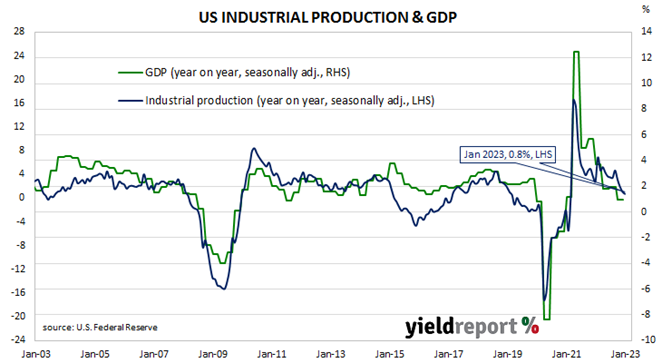
The Federal Reserve’s industrial production (IP) index measures real output from manufacturing, mining, electricity and gas company facilities located in the United States. These sectors are thought to be sensitive to consumer demand and so some leading indicators of GDP use industrial production figures as a component. US production collapsed through March and April of 2020 before recovering the ground lost over the fifteen months to July 2021.
According to the Federal Reserve, US industrial production remained steady on a seasonally adjusted basis in January. The result was less than the 0.5% increase which had been generally expected but more than December’s -1.0% after it was revised down from -0.7%. On an annual basis the growth rate slowed from December’s revised figure of 1.1% to 0.8%.
“US industrial production was flat but was held down by an 8.9% plunge in utilities output on reduced demand for heating,” noted NAB Senior FX Strategist (Markets) Rodrigo Catril.
The figures came out the same morning as the latest retail sales figures and longer-term US Treasury bond yields rose moderately while short-term yields declined on the day. By the close of business, the 2-year Treasury yield had slipped 1bp to 4.61% while 10-year and 30-year yields both finished 5bps higher at 3.80% and 3.84% respectively.
In terms of US Fed policy, expectations of higher federal funds rates over the next 12 months mostly softened slightly. At the close of business, contracts implied the effective federal funds rate would average 4.66% in March, 8bps higher than the current spot rate, and then climb to an average of 4.85% in April. May futures contracts implied a 5.035% average effective federal funds rate while December contracts implied 5.105%.
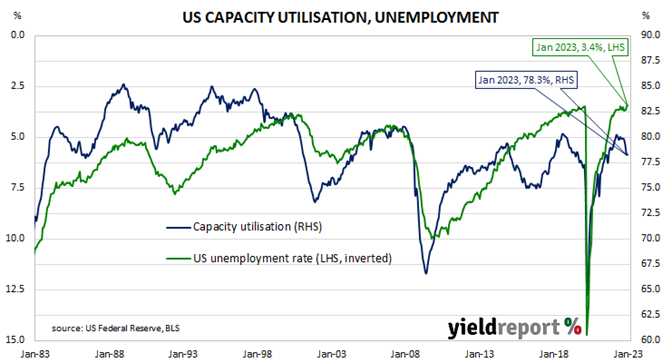
The same report includes US capacity utilisation figures which are generally accepted as an indicator of future investment expenditure and/or inflationary pressures. Capacity usage had hit a high for the last business cycle in early 2019 before it began a downtrend which ended with April 2020’s multi-decade low of 64.2%. January’s reading slipped from December’s revised figure of 78.4% to 78.3%, below the long-term average of 80.0%.
While the US utilisation rate’s correlation with the US jobless rate is solid, it is not as high as the comparable correlation in Australia.