
Summary –
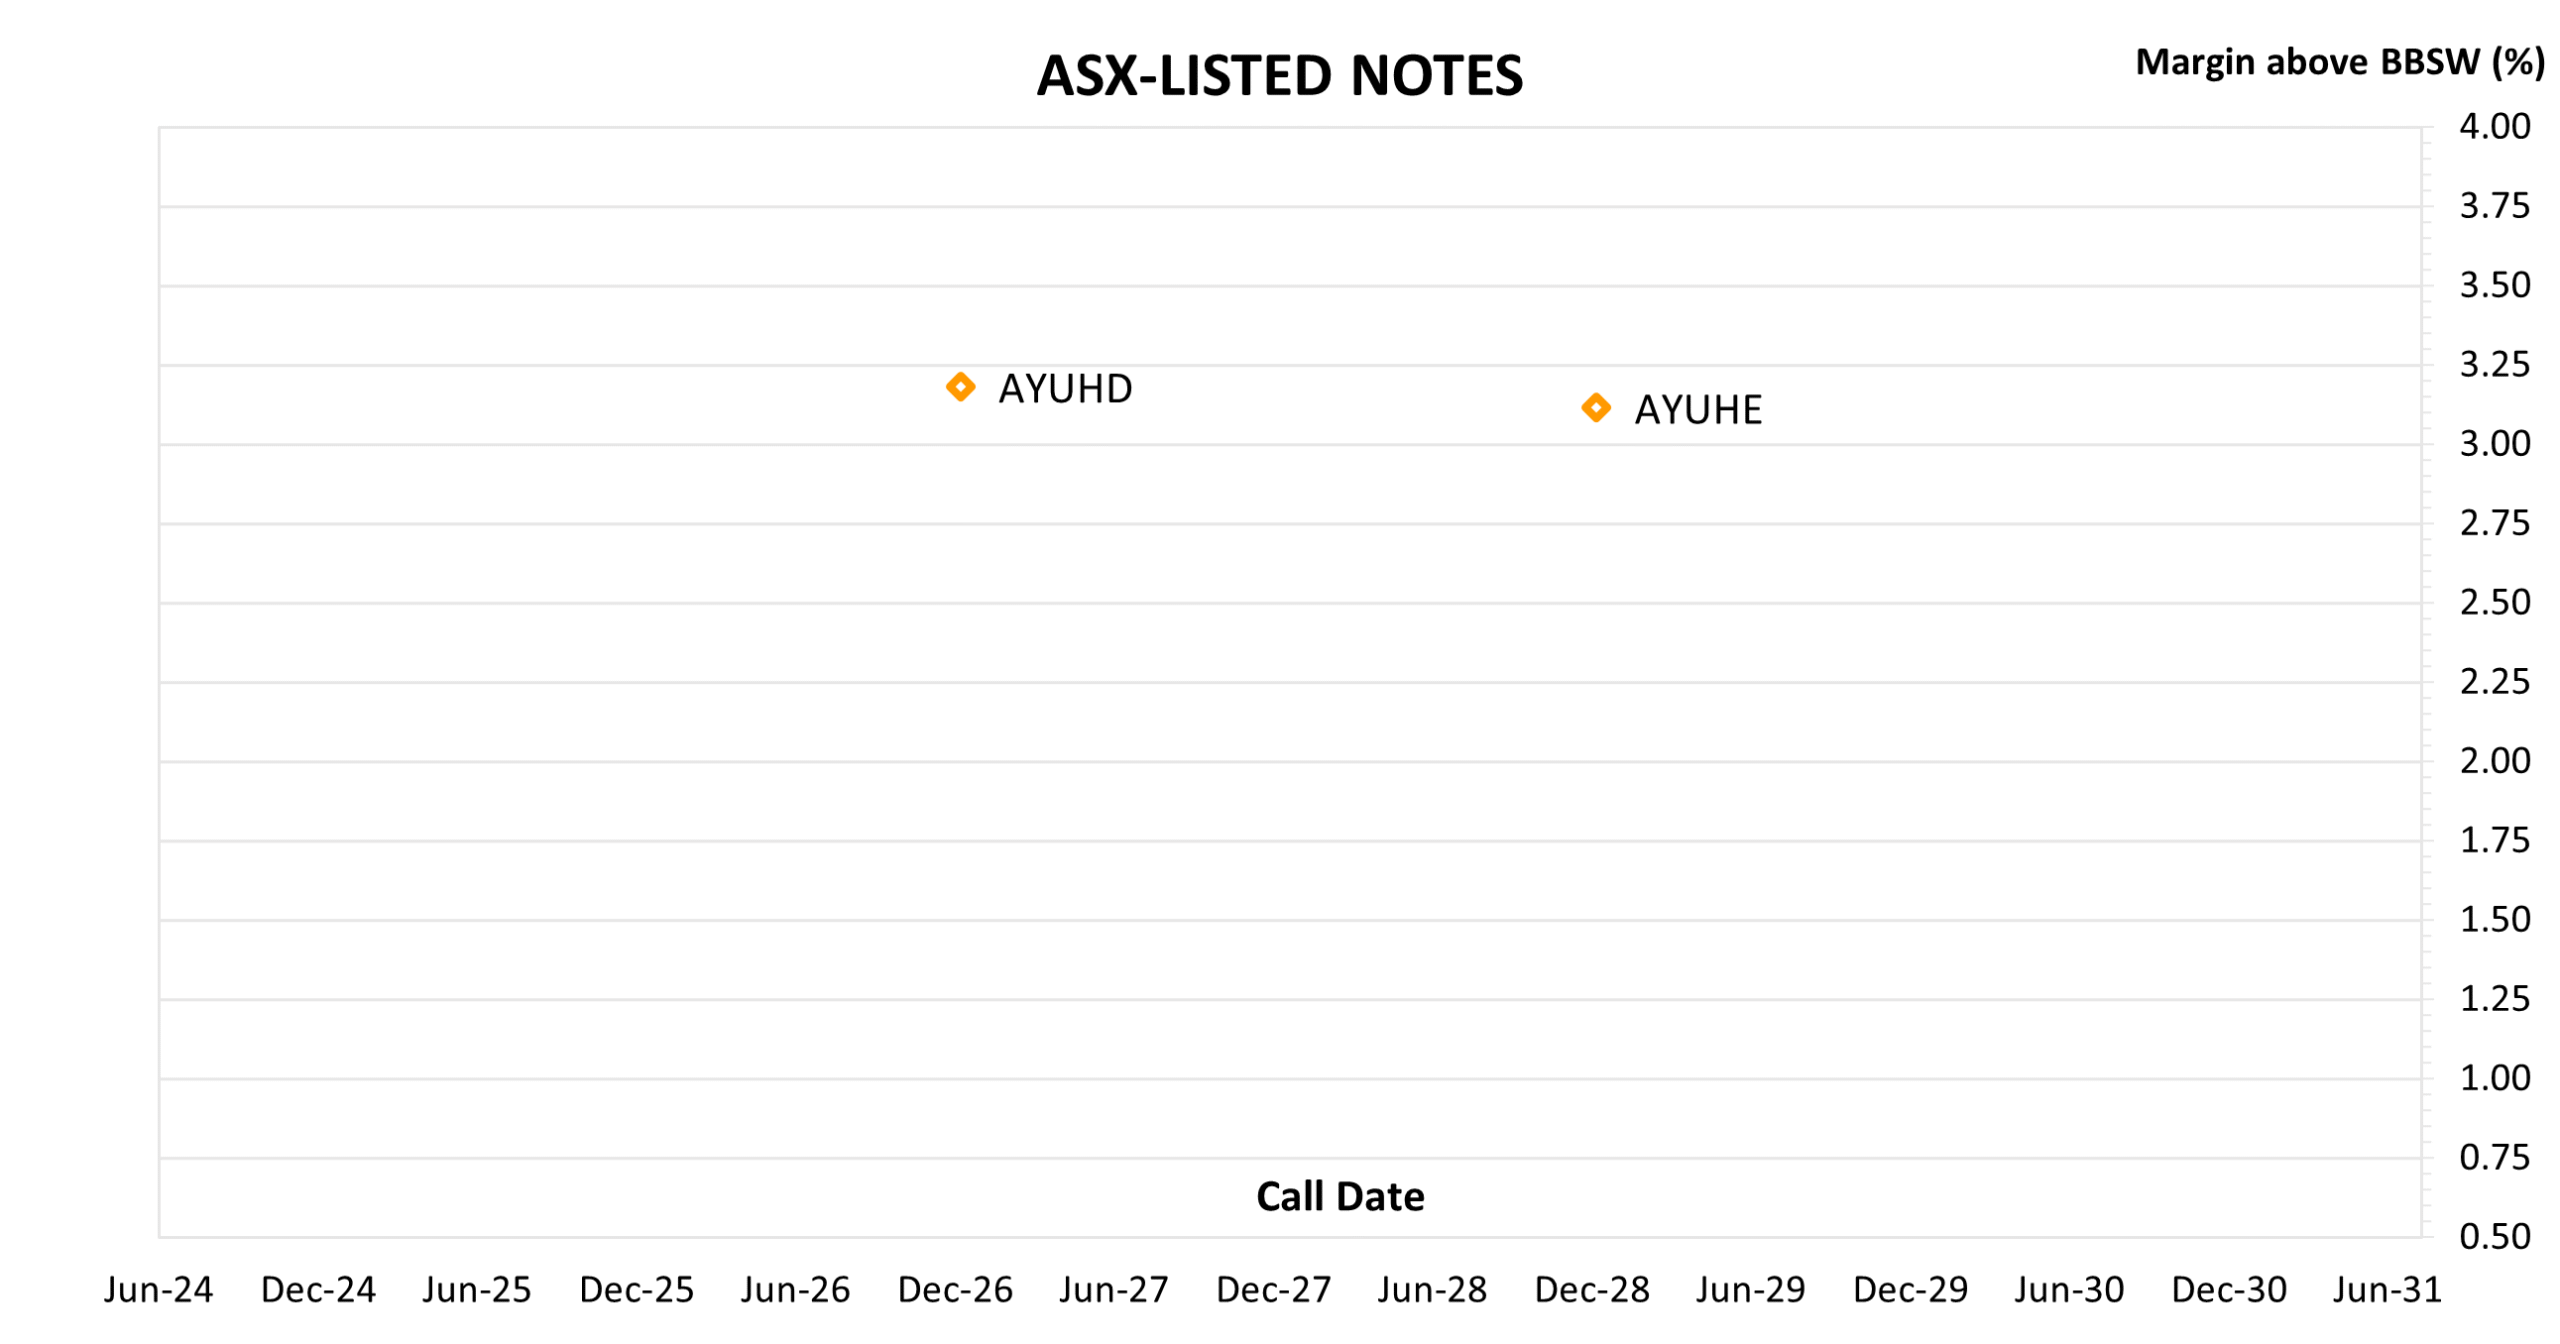
The current landscape of ASX-listed floating rate notes reveals a nuanced interplay between call dates, trading margins, and investor sentiment. The scatter plot highlights two key instruments—AYUHD and AYUHE—both issued by Australian Unity, with margins above BBSW clustering around 3.25%. AYUHD is callable in June 2026, while AYUHE extends to June 2027, offering investors a slightly longer exposure with similar margin uplift.
Complementing this visual, the tabular data introduces Centuria Capital’s C2FHA note, which stands out with a significantly higher trading margin of 6.58% and a running yield of 7.92%. This suggests a market premium for shorter-dated instruments with elevated credit or liquidity risk, as C2FHA matures in April 2026 and carries a notably higher issue margin of 4.25%.
Key Observations:
-
AYUHD vs AYUHE: Despite differing maturities (2026 vs 2028), both maintain comparable trading margins (~3.1–3.2%), indicating stable investor confidence in Australian Unity’s credit profile across tenors.
-
C2FHA Premium: The 6.58% trading margin and 3.89% weekly delta suggest heightened market activity or repricing, possibly due to macro shifts or issuer-specific developments.
-
Yield Dynamics: AYUHE offers the highest running yield among the Unity notes (6.15%), reinforcing its appeal for yield-seeking investors with a longer horizon.
Overall, the data underscores a bifurcation in investor appetite—between high-yield, short-dated notes like C2FHA and more stable, mid-term instruments from Australian Unity. This reflects broader themes in the hybrid and note market: balancing credit risk, duration, and yield in a shifting rate environment.
ASX-LISTED FLOATING RATE NOTES
| COMPANY | CODE | BOND TYPE | MATURITY | ISSUE MARGIN | TRADING MARGIN | Δ WEEK | WEEK CLOSE | RUNNING YIELD** |
|---|---|---|---|---|---|---|---|---|
| Centuria Capital | C2FHA | Note | 20-Apr-26 | 4.25% | 6.58% | 3.89% | 101.721 | 7.92% |
| Australian Unity | AYUHD | Bond Series D | 15-Dec-26 | 2.15% | 3.18% | 0.67% | 101.25 | 5.78% |
| Australian Unity | AYUHE | Bond Series E | 15-Dec-28 | 2.50% | 3.12% | 0.85% | 101.1 | 6.15% |
For a full breakdown of trading activity, margin changes, and performance insights, visit the