JCB find the YieldReport to be an invaluable summary of all debt market activity. Whilst we are focussed on the highest grade bonds it is important to see what is..Angus Coote, Executive Director, JCB Active Bond Fund
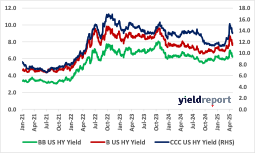
Corporate bonds moved slightly higher. By Friday close, the high yield aggregate yield had increased 6 bps to 7.75%, the BB 4bps to 6.36%, the B 4bps to 7.88% and the CCC 2bps to 13.70%. It was actually a de-risk week.
As we noted last week, there is a mountain of money going into new issuance. During the week, US and European companies raced to issue debt looking to seize on the risk on mood in markets after the easing of US and China trade tensions. Europe had the busiest week since January with volume topping 90 billion euros, McDonald’s and Pfizer joining a records spree of reverse Yankee bond issuance that now stands at over 82 billion euros. It was Pfizer’s first euro bond in seven years.
In the US, investment grade sales volume came in above $40 billion for the second consecutive week. Sales were highlighted by UPS us, bankcorp and SocGen for the month. The total sits at $95 billion. Meanwhile, in high yield companies sold high yield bonds totalling more than $11 billion for the week. It included sales from the likes of Avis Carnival and coals and particular the coal sale was its first since 2021 and the first time the company has ever tapped the high yield market, it saw one and three quarters of a billion dollars of demand for its $360 million sale.
In Australia, the domestic A$ market is beginning to heat up after a slow April due to the combination of Trump-induced volatility and the Easter/ANZAC break. Over April, only one A$ credit deal priced over the month in Sydney Airport, albeit we note the below chart specifically is filtered by issuance date, rather than pricing date (with two deals being priced in March and settling in April). Nonetheless, this was the slowest month for A$ benchmark credit deals since March 2020 – with no financials issuance for over six weeks.
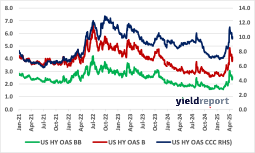
Thanks to recent trade optimism spreads have dropped and made the market appealing for companies. Looking to raise cash is also caused some big bank analysts this week to predict tighter spreads by the end of the year. There is certainly a more challenging growth inflation mix over the long term. The key point there is that the magnitude and the timing of that is very uncertain. There’s a reason that spreads, for example, are still wider than where they were at the start the year. Spreads, are now back to mid-March levels. But they are not back to the post-financial crisis new tights that were set in February. So, there is a degree of risk premium baked in. They could widen, one saving grace, however, in the corporate credit market is that the all in yield opportunity is still really attractive.
Three things are standing out in terms of investor behaviour currently. One, there’s an acknowledgement that there’s a lot of uncertainty, but there is an optimism that the US economy can power through this. Two, there’s a significant focus on what would be characterised as back to basics credit work, acknowledging that the market does not understand a lot of the forward path, but focusing on what can be controlled – underwriting, structured cash flows, etc. Third, there are a significant amount of focus on finding opportunities to navigate in this environment. This has been evident in over-subscription levels of new issues. This is also evident in the last three weeks of inflows in the US high yield market. It’s a proactive approach, reflecting an acknowledgement that most can’t time when the hard data, for example, might catch to the soft data and, in the interim, investors do not want to be under-risked or under-invested.
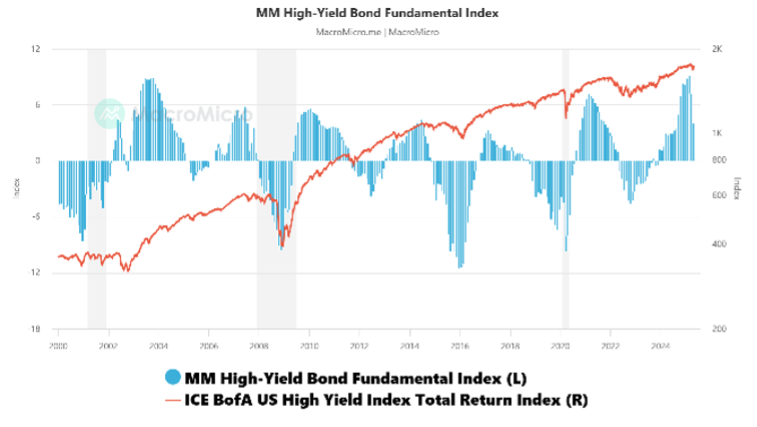
Figure 1: US High Yield Bond Fundamental Index
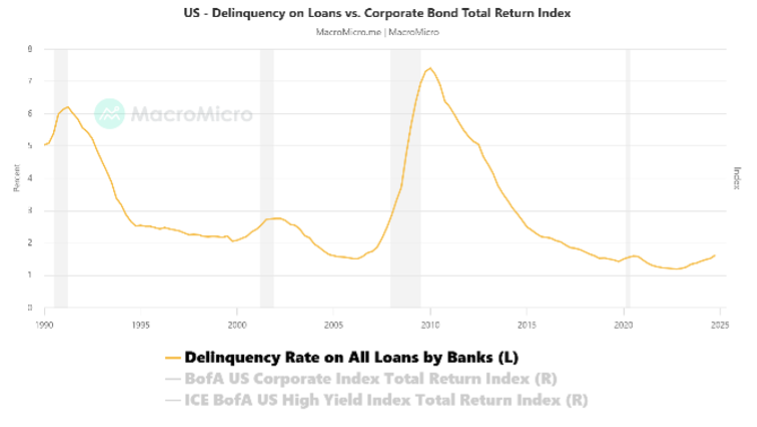
Figure 2: Delinquency on US Loans
In relation to Figure 1, the MM Fundamental Index for high-yield bonds is an integral index for assessing the fundamentals of junk bonds. When it goes up, the fundamentals of junk bonds are looking good. The Fundamental Index is updated with the monthly value on the last Friday of each month, and there may be subsequent changes due to data revisions for its constituent variables.
In relation to Figure 2, the US Fed surveys large commercial banks on the delinquency rates on loans and leases each quarter. As delinquency rates on loans and leases reflect the overall debt repayment capacity of businesses, delinquency rates serve as an important indicator of corporate bond defaults. The latest statistics are very solid: Delinquency Rate on All Loans by Banks (2024-Q4): 1.62%. Previous month: 1.52%