Summary:
The “Credit Spreads” chart tracks the evolution of credit risk premiums across major debt instruments from April 1992 to September 2025. It compares spreads for U.S. senior loans, high-yield bonds, investment-grade credit, and emerging market credit, alongside the 10-year Treasury term premium. Key instruments include the S&P/LSTA US Leveraged Loan Index (495bps), Barclays US High Yield Index (396bps), Investment Grade Credit (72bps), and Emerging Market Credit (318bps). The Adrian, Crump & Moench Treasury term premium is also plotted for macro context.
Historically, credit spreads spike during periods of financial stress—most notably during the 2008 global financial crisis and the 2020 pandemic—reflecting heightened investor risk aversion. The current elevated spreads in leveraged loans and high-yield bonds suggest persistent concerns about credit quality and economic uncertainty. Investment-grade spreads remain relatively tight, indicating continued demand for safer assets. Emerging market credit spreads are elevated, reflecting geopolitical risks and tighter global financial conditions.
The chart underscores the cyclical nature of credit markets and the sensitivity of spreads to macroeconomic shocks, monetary policy shifts, and investor sentiment. As of September 2025, the divergence in spread levels across instruments signals a cautious market stance, with investors demanding higher compensation for riskier exposures amid lingering inflation and rate volatility.
Figure 1- US Corporate Bonds Yields
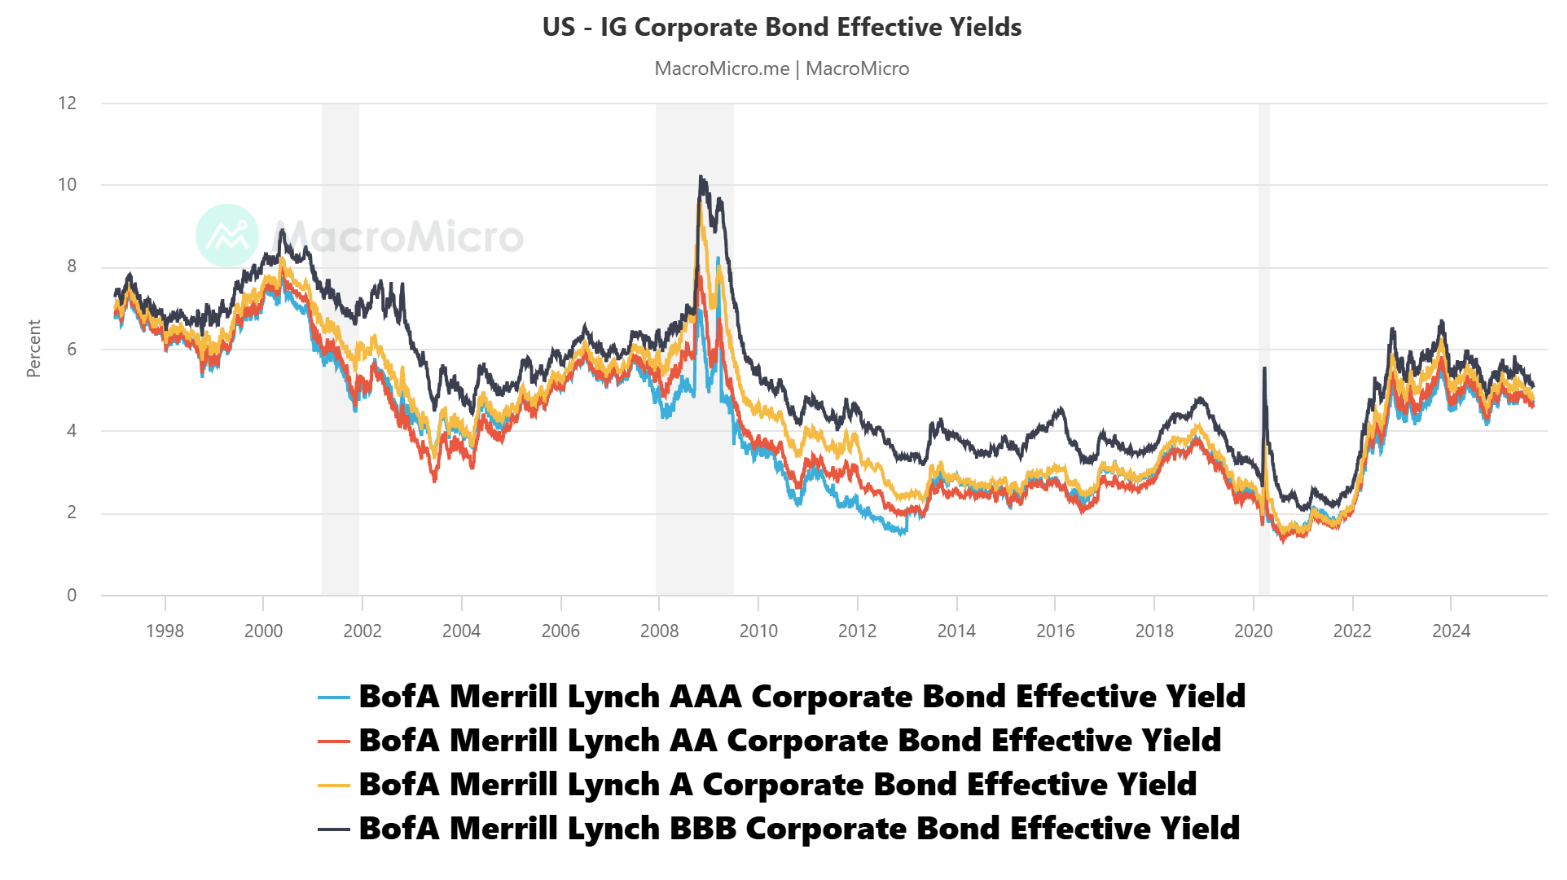
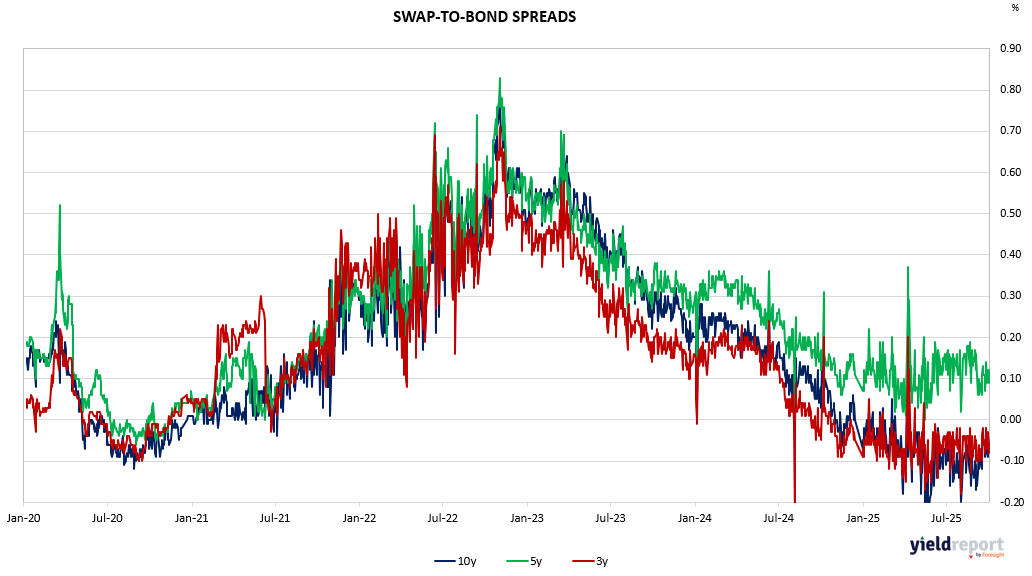
Figure 2: Australian Swap to Bond Spreads