
Elstree Investment Management is a Melbourne-based fund manager which specialises in ASX-listed hybrid securities and notes. In its latest review it revisited a diagram which illustrates what happens to the prices of hybrids when the sharemarket has a bout of volatility, such as the one experienced at the very beginning of February.
Some time ago, Elstree constructed an index which represents price movements of hybrid securities. As such, it is a weighted average of various hybrids’ prices from day to day and it is meant to give a feeling for where prices have been. Whereas the All Ordinaries Index is designed to give a feeling for prices of the overall share market, Elstree’s index is limited to a basket of hybrids.
The chart below compares the two indices. When the lines are at 100 (top horizontal line), the market indices are at all-time highs and where the lines are below 100, it indicates the fall from the previous all-time high. (The hybrids index is the red line and the All Ordinaries index is the blue line.)
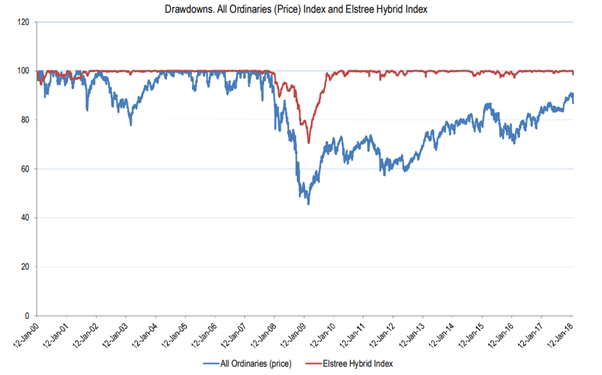
Here’s the punchline. “In the pre and post GFC period, hybrid markets aren’t much affected by what is going on in equity markets. If you take all equity market falls over 7%, the average equity market fall is 11.1% and hybrid markets over the same periods fell by 1.1% on average.”