
The US yield curve has been attracting quite a bit of attention recently, especially now the gap between 2 year Treasury bonds and 10 year Treasury bonds is so small. The reason for this attention lies in the reliability of a negative spread as a predictor of US recessions since the 1950s.
FOMC minutes through 2018 indicate the slope of the yield curve has been regularly discussed in recent months. Some Federal Reserve members have even gone so far as to state publicly they would oppose any rate rise which would invert the yield curve. Bank of Atlanta President Raphael Bostic said he “will not vote for anything that will knowingly invert the curve…” despite his belief an inverted curve does not necessarily always precede a recession.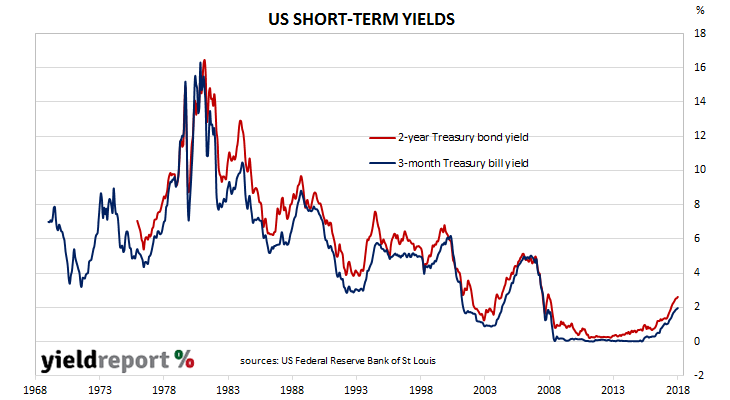 Just what is an inverted or inverse yield curve? Put simply, a yield curve is inverted if long-term yields are less than short-term yields. If a bond’s yield is plotted against its time to maturity and then this process is repeated for bonds from the same issuer with various times to maturity, most of the time it looks like an uphill slope from left to right. In mathematical terms, the gradient is positive. However, sometimes the curve slopes downhill and the gradient is negative, thus producing a yield curve which is then described as “negative” or “inverse”.
The slope or gradient of a curve can be calculated mathematically by measuring between two points, usually one at the very beginning or a curve and one at the very end. In the case of the US government yield curve, this suggests taking the yield on a 3-month Treasury bill and comparing it to a 30-year Treasury bond yield.