News

“Soft start” to 2021 credit growth, some “encouraging signs”

26 February 2021

Summary: Private sector credit maintains modest growth rate in January; under expected figure; “slowest annual pace since 2010”; housing credit growth continues but business loans contract; some “encouraging signs”.


The pace of lending to the non-bank private sector by financial institutions in Australia has been trending down since late-2015. Private sector credit growth appeared to have stabilised in the September quarter of 2018 but the annual growth rate then continued to deteriorate through to the end of 2019. The early months of 2020 provided some positive signs but they disappeared in April and have not re-emerged as yet.

According to the latest RBA figures, private sector credit growth continued at a modest rate in January, rising by 0.2%. The result was under the generally expected figure of 0.3%, which also happened to be the size of December’s increase. The annual growth rate slipped from 1.8% in December to 1.7%.

“For 2021, it has been a soft start to the year. That result, matching the outcome for November, is the slowest annual pace since 2010, in the aftermath of the GFC,” said senior Westpac senior economist Andrew Hanlan.

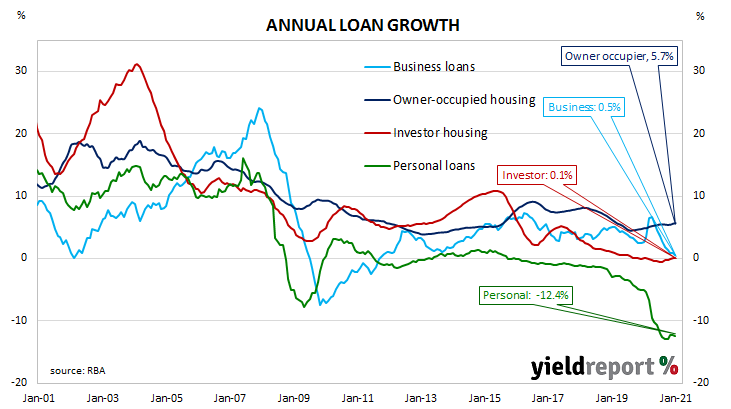
Owner-occupier and investor loans accounted for all the net growth over the month. Business lending contracted and personal debt fell again.

Commonwealth bond yields jumped on the day, broadly following significantly higher US Treasury yields at the close of trading on Friday morning. At the close of business, the 3-year yield ACGB had gained 7bps to 0.37%, the 10-year yield had leaped by 18bps to 1.91% while the 20-year yield finished 12bps higher at 2.57%.

The traditional driver of loan growth rates, the owner-occupier segment, grew by 0.5% over the month, slightly slower than December’s 0.6%. The sector’s 12-month growth rate accelerated from 5.6% to 5.7%.

Growth rates in the business sector remained sluggish and business credit shrank by 0.1%, down from +0.3% in December. The segment’s annual growth rate slowed further, from December’s revised rate of 0.9% to 0.5%.

A zero-coupon convertible note?

25 February 2021

Summary: Afterpay issues zero-coupon convertible note; similar to Xero convertible note issued last year; March year 2026 maturity.


Convertible notes have been around for decades, if not centuries. Traditionally they have been used to raise capital by issuers in a manner which placates investors which otherwise might baulk at stumping up funds for what could been seen a risky proposition. Essentially, a convertible note is a bond stapled to a call option on the issuer’s ordinary shares.

Afterpay, Australia’s buy-now-pay-later business, has gone down this route for raising capital to finance an increase of its interest in Afterpay US Inc. from 80% to 93%.

However, Afterpay’s convertible note has a twist; the note will not pay interest. It takes one of the attractive parts of a bond, the interest, out of the equation. However, it still leaves in place the safety aspect of having a bond-like security, along with the potential upside of the call option component.

The offer of a zero-coupon convertible note is a novel approach but it is not the first ASX-listed company to do so. Xero issued a zero coupon bond in November 2020 with a December 2025 maturity date. Under the terms of the Xero convertible note, the call option has a strike price of USD$134.7246, or 35% above Xero’s share price in US dollars at the time.

Afterpay’s convertible notes have a similar conversion feature. The call option component has a strike price of $194.822, or 45% above Afterpay’s closing share price on 24 February. The maturity date is on 12 March 2026.

As with Xero’s convertible notes, Afterpay’s convertible notes will be listed on the Singapore Stock Exchange.

US consumers “cautiously optimistic” overall

23 February 2021

Summary: US consumer confidence rises in February; Conference Board index increases, more than expected; view of present conditions improve, views of future conditions slip slightly; economic growth “not slowed further”, consumers “cautiously optimistic” overall.


After the GFC in 2008/09, US consumer confidence clawed its way back to neutral over a number of years and then went from strength to strength until late 2018. Measures of consumer confidence then oscillated within a fairly narrow band at historically high levels until they plunged in early 2020. Subsequent readings have fluctuated around the long-term average.

The latest Conference Board survey held during the first week-and-a-half of February indicated US consumer confidence improved compared with the previous month. February’s Consumer Confidence Index registered 91.3, above the median consensus figure of 90 and more than January’s final figure of 88.9. Consumers’ views of present conditions improved while their views regarding future conditions deteriorated slightly compared to those held at the time of the previous survey.

Lynn Franco, a senior director at The Conference Board, said the increase in the current conditions index after declining for three months “suggests economic growth has not slowed further.” She described US consumers as “cautiously optimistic, on the whole”.

US Treasury bond yields moved very little on the day. By the close of business, the 2-year yield Treasury bond yield remained unchanged at 0.11%, the 10-year yield had slipped 1bp to 1.35% and the 30-year yield finished unchanged at 2.18%.

In terms of US Fed policy, expectations of any change in the federal funds rate over the next 12 months maintained a neutral bias. Federal funds futures contracts for February 2022 implied an effective federal funds rate of 0.095%, about 2bps above the current spot rate.

US leading index beats estimates

22 February 2021

Summary: Latest US leading index reading increases above expectations; improvements remain “broad-based”, solid March quarter implied; Conference Board forecasts 4.4% growth over 2021.


The Conference Board Leading Economic Index (LEI) is a composite index composed of ten sub-indices which are thought to be sensitive to changes in the US economy. The Conference Board describes it as an index which attempts to signal growth peaks and troughs; turning points in the index have historically occurred prior to changes in aggregate economic activity. Readings from March and April signalled “a deep US recession”; more recent readings indicated the US recovery is still underway, albeit at a slowing pace.

The latest reading of the LEI indicates it rose by 0.5% in January. The result was above the 0.3% increase which had been generally expected and more than December’s 0.4% after it was revised up from 0.3%. On an annual basis, the LEI growth rate increased from -1.5% after revisions to -1.4%.

“While the pace of increase in the U.S. LEI has slowed since mid-2020, January’s gains were broad-based and suggest economic growth should improve gradually over the first half of 2021,” said Ataman Ozyildirim, Senior Director of Economic Research at The Conference Board. He expects the US labour market and GDP growth “to continue improving through the rest of this year as well.”

Changes over time can be large but once they are standardised, a clearer relationship with GDP emerges. The latest reading implies a 0.1% year-on-year growth rate in April, the same figure as in March after revisions. For this to take place, a 1.3% rise in the March quarter would be required. The Conference Board currently forecasts a 4.4% expansion across all of calendar 2021.

German economy “robust” in February

22 February 2021

Summary: ifo business climate index up in February; higher than expected figure; ifo president describes German economy as “robust”; index still implies negative euro-zone GDP growth.


Following a recession in 2009/2010, the ifo Institute’s business climate index largely ignored the European debt-crisis of 2010-2012, remaining at average-to-elevated levels through to early-2020. However, the index was quick to react in the March 2020 survey, falling precipitously. The rebound which began in May was almost as sharp but subsequent readings have not continued this trend.

According to the latest figures released by the Institute, its business climate index increased to 92.4 in February, continuing a run of readings near 90. The reading was above the expected reading of 89.7 and 2.1 points above January’s final reading of 90.3. The average reading since January 2005 is just below 97.

The expectations index also increased, rising from January’s revised figure of 91.5 to 94.2, also above the generally-expected figure of 91.7. The current situation index rose from 89.2 to 90.6.

“Assessments of the current business situation were more positive. Moreover, pessimism regarding the coming months was markedly reduced. The German economy is proving robust despite the lockdown, especially thanks to strength in industry,” said Clemens Fuest, the president of the ifo Institute.

Euro-zone consumer confidence still stagnating

18 February 2021

Summary: Euro-zone households less pessimistic in February; slightly below consensus expectation; still below long-term average; major euro-zone bond yields up moderately.


EU consumer confidence plunged during the GFC and again in 2011/12 during the European debt crisis. After bouncing back through 2013 and 2014, it fell back significantly in late 2018 but only to a level which corresponds to significant optimism among households. Following the plunge which took place in April 2020, a recovery of sorts began in May. More recent readings have generally stagnated at below-average levels.

The February survey conducted by the European Commission indicated its Consumer Confidence index increased to -14.8. The reading was slightly less than the -14.5 which had been generally expected but higher than January’s figure of -15.5. The average reading since the beginning of 1985 has been -11.7.

Sovereign bond yields increased in major European bond markets on the day. By the end of it, the German 10-year bund yield had gained 3bps to -0.34% while the French 10-year OAT bond yield finished 4bps higher at -0.08%.

“Encouraging” figures for US output, capacity usage; still below pandemic levels

17 February 2021

Summary: US output expands in January; rise much higher than expected figure; capacity utilisation rate increase above 75%; data “encouraging” but still below pandemic levels.


The Federal Reserve’s industrial production (IP) index measures real output from manufacturing, mining, electricity and gas company facilities located in the United States. These sectors are thought to be sensitive to consumer demand and so some leading indicators of GDP use industrial production figures as a component. Production began recovering in May 2020 and subsequent months after collapsing in the previous two months.

US industrial production expanded by 0.9% on a seasonally adjusted basis in January. The result was much higher than the 0.4% increase which had been generally expected but less than December’s 1.3% rise after it was revised down from 1.6%. On an annual basis, the contraction rate decreased from December’s revised figure of -3.2% to -1.8%.

The report was released on the same day as January PPI figures, January retail sales numbers and the minutes of the FOMC’s January meeting. Despite the robust figures, US Treasury bond yields moved lower across the curve, aided by a paragraph in the minutes which stressed the need to “abstract from temporary factors affecting inflation”. By the end of the day, the 2-year Treasury yield had shed 2bps to 0.10%, the 10-year yield had lost 4bps to 1.27% while the 30-year yield finished 5bps lower at 2.04%.

The same report includes US capacity utilisation figures which are generally accepted as an indicator of future investment expenditure and/or inflationary pressures. Capacity usage had hit a high for the last business cycle in early 2019 before it began a downtrend which ended with April’s multi-decade low of 64.2%. January’s reading increased to 75.6% from December’s revised figure of 74.9%.

Higher US core PPI rate may indicate “mounting” inflation pressures

17 February 2021

Summary: Prices received by producers jump in January; increase well above expectations; “core” PPI also jumps; higher core rate raises concerns of “mounting pipeline inflation pressures”; US bond yields down among flurry of data, FOMC minutes.


Around the end of 2018, the annual inflation rate of the US producer price index (PPI) began a downtrend which then continued through 2019. Months in which producer prices increased suggested the trend may have been coming to an end, only for it to continue, culminating in a plunge in April. Figures from subsequent months suggest a return to “normal” may be taking place.

The latest figures published by the Bureau of Labor Statistics indicate producer prices leaped by 1.3% after seasonal adjustments in January. The increase was well above the 0.4% rise which had been generally expected and much higher than December’s 0.3% rise. On a 12-month basis, the rate of producer price inflation after seasonal adjustments increased from 0.7% to 1.8%.

PPI inflation excluding foods and energy rose by 1.2% after recording a 0.1% decline in November and a 0.1% increase in December. The annual rate accelerated from 1.2% in December to 2.0%.

ANZ economist Daniel Been said the rise in the core rate raised “concerns about mounting pipeline inflation pressures.”

The report was released on the same day as January industrial production report, January retail sales numbers and the minutes of the FOMC’s January meeting. Despite the robust figures, US Treasury bond yields moved lower across the curve, aided by a paragraph in the minutes which stressed the need to “abstract from temporary factors affecting inflation”. By the end of the day, the 2-year Treasury yield had shed 2bps to 0.10%, the 10-year yield had lost 4bps to 1.27% while the 30-year yield finished 5bps lower at 2.04%.

US retail starts 2020 at “brisk” rate

17 February 2021

Summary:  US retail sales jump in January; rise much, much higher than expected figure; increase a “brisk start”; reversal in Feb expected given cold weather, new restrictions; growth in all retail categories; “non-store retailers” the largest influence on total.


US retail sales had been trending up since late 2015 but, commencing in late 2018, a series of weak or negative monthly results led to a drop-off in the annual growth rate below 2.0% by the end of that year. Growth rates then increased in trend terms through 2019 and into early 2020 until pandemic restrictions sent it into negative territory. A “v-shaped” recovery has since taken place.

According to the latest “advance” sales numbers released by the US Census Bureau, total retail sales jumped by 5.3% in January. The gain was much, much higher than the 0.8% increase which had been generally expected and in stark contrast to December’s -1.0% after revisions. On an annual basis, the growth rate increased from 2.5% to 7.4%.

ANZ economist Daniel Been described the increase as “a very brisk start to the year for consumption…”

The report was released on the same day as January PPI figures, January industrial production numbers and the minutes of the FOMC’s January meeting. Despite the robust figures, US Treasury bond yields moved lower across the curve, aided by a paragraph in the minutes which stressed the need to “abstract from temporary factors affecting inflation”. By the end of the day, the 2-year Treasury yield had shed 2bps to 0.10%, the 10-year yield had lost 4bps to 1.27% while the 30-year yield finished 5bps lower at 2.04%.

NAB Head of FX Strategy within its FICC division Ray Attrill said, “February seems bound to see a correction, especially given the Arctic weather and as new restrictions came into effect following President Biden’s inauguration.” However, he noted “another surge in spending is to be expected” should the Biden administration’s proposed fiscal package be passed by the US Congress.

Growth was recorded across all categories over the month. The “Non-store retailers” segment provided the largest influence on the overall result. Sales in this segment increased by 11.0% over the month and by 28.7% on an annual basis.

Leading index: robust March, June quarter ahead

17 February 2021

Summary:  Leading index increases in January; continues likelihood of above-trend growth; reading implies annual GDP growth to rise to +7.25% during first half of 2021; February SoMP GDP forecasts 8% growth to June.


Westpac and the Melbourne Institute describe their Leading Index as a composite measure which attempts to estimate the likely pace of Australian economic growth over the next three to six months. After reaching a peak in early 2018, the index trended lower through 2018, 2019 and the early months of 2020 before plunging to recessionary levels in the second quarter. Readings from the third and fourth quarters were markedly higher.

The latest reading of the six month annualised growth rate of the indicator increased in January, from December’s revised figure of +4.24% to +4.48%

“The growth rate of the Index continues to point to above-trend growth in the Australian economy through 2021,” said Westpac Chief Economist Bill Evans.

Index figures represent rates relative to trend-GDP growth, which is generally thought to be around 2.75% per annum. The index is said to lead GDP by three to six months, so theoretically the current reading represents an annualised GDP growth rate of around 7.25% in the second or third quarters of 2021.

Commonwealth Government bond yields moved significantly higher on the day, largely following similar rises in US Treasury bond markets overnight. By the end of the day, the 3-year ACGB yield had gained 3bps to 0.2%, the 10-year yield had jumped by 8bps to 1.41% while the 20-year yield finished 6bps higher at 2.11%.

In the cash futures market, expectations of a change in the actual cash rate, currently at 0.03%, moved up a touch. At the end of the day, contract prices implied the cash rate would inch up slowly to around 0.08% by mid-2022.

Click for more news