Summary: ISM purchasing managers index (PMI) down; below consensus expectation; economists focus on higher “prices paid” component; reading implies US economy still growing at solid pace.
US purchasing managers’ index (PMI) readings reached a cyclical peak in September 2017 before they started a downtrend which stabilised in late 2019 after a truce of sorts was made with the Chinese regarding trade. March’s report signalled a contraction in US manufacturing activity had begun and it stayed in this state until June. Subsequent month’s readings have implied a return to expansion for US manufacturing.
According to the latest Institute of Supply Management (ISM) survey, its Purchasing Managers Index recorded a reading of 58.7% in January. The result was less than the generally expected figure of 60.0 and lower than December’s reading of 60.5%. The average reading since 1948 is 52.9% and any reading above 50% implies an expansion in the US manufacturing sector relative to the previous month.
Westpac economist Lochlan Halloway focussed on a “sharp lift” in prices paid. ANZ senior economist Felicity Emmett picked up on the same issue, noting the prices paid index was at its “the highest reading since 2011”, something she attributed to strong commodity prices.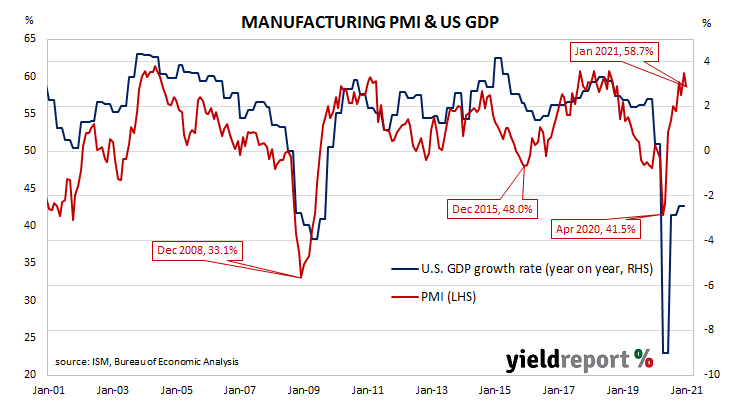
Longer-term US Treasury bond yields increased moderately on the day. By the close of business, the 10-year Treasury bond yield had added 2bps to 1.08% and the 30-year yield had gained 3bps higher at 1.86%. The 2-year yield remained unchanged at 0.11%.
Purchasing Managers’ Indices (PMIs) are economic indicators derived from monthly surveys of executives in private-sector companies. They are diffusion indices, which means a reading of 50% represents no change from the previous period, while a reading under 50% implies respondents reported a deterioration on average. According to the ISM, a reading “above 42.8%, over a period of time, generally indicates an expansion of the overall economy,”
Manufacturing PMI figures appear to lead US GDP by several months despite a considerable error in any given month. The chart below shows US GDP on a “year on year” basis (and not the BEA annualised basis) against US GDP implied by monthly PMI figures.