News

US household confidence improves as households look to better prospects

26 January 2021

Summary: US consumer confidence rises in January; Conference Board index increases, more than expected; view of present conditions deteriorate, views of future conditions improve; COVID-19 “still the major suppressor”.


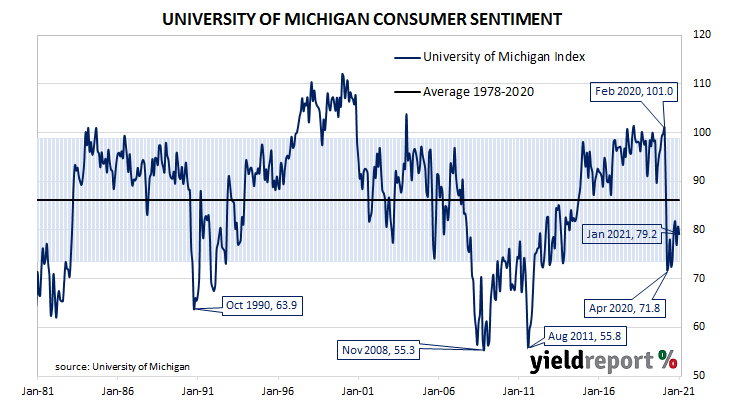
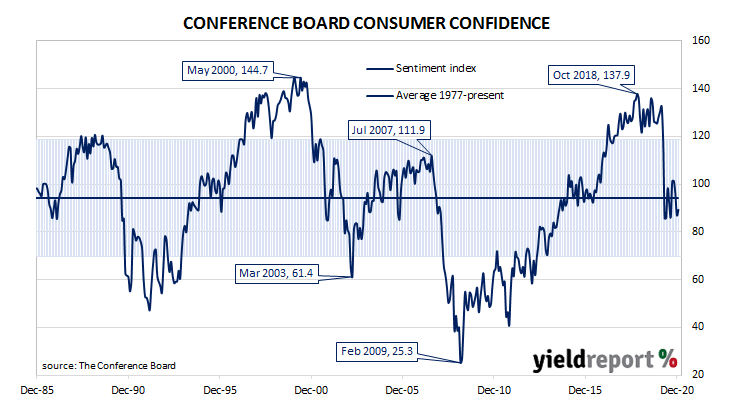
After the GFC in 2008/09, US consumer confidence clawed its way back to neutral over a number of years and then went from strength to strength until late 2018. Measures of consumer confidence then oscillated within a fairly narrow band at historically high levels until they plunged in early 2020. Subsequent readings have oscillated around the long-term average.

The latest Conference Board survey held during the first half of January indicated US consumer confidence has improved compared with the previous month. January’s Consumer Confidence Index registered 89.3, above the median consensus figure of 88.8 and more than December’s final figure of 87.1. Consumers’ views of present conditions declined but their views regarding future conditions improved compared to those held at the time of the December survey.

Lynn Franco, a senior director at The Conference Board, said COVID-19 was “still the major suppressor” of consumers’ views of present conditions but they “foresee conditions improving in the not-too-distant future.”

US Treasury bond yields moved a little each way. By the end of the day, the 2-year yield Treasury bond yield had slipped 1bp to 0.12%, the 10-year yield had inched up 1bp to 1.04% while the 30-year yield finished 1bp lower at 1.79%.

In terms of US Fed policy, expectations of any change in the federal funds rate over the next 12 months maintained a neutral bias. Federal funds futures contracts for January 2022 implied an effective federal funds rate of 0.075%, just under the current spot rate.

German recovery halted “for now”: ifo

25 January 2021

Summary: ifo business climate index down in January; less than expected figure; ifo president says second wave brings German recovery “to a halt for now”.


Following a recession in 2009/2010, the ifo Institute’s business climate index largely ignored the European debt-crisis of 2010-2012, remaining at average-to-elevated levels through to early-2020. However, the index was quick to react in the March 2020 survey, falling precipitously. The rebound which began in May was almost as sharp but readings through to the end of 2020 did not continue that trend.

According to the latest figures released by the Institute, its business climate index fell to 90.1 in January, continuing a six-month run of readings near 90. The reading was just below the expected reading of 91.4 and 2.1 points below December’s final reading of 92.2. The average reading since January 2005 is just above 97.

The expectations index also lost ground, falling from December’s revised figure of 93.0 to 91.1 in January, also below the expected figure of 93.6. The current situation index declined from 91.3 to 89.2.

“Companies assessed their current situation as worse than last month. Their expectations were also more pessimistic. The second wave of coronavirus has brought the recovery of the German economy to a halt for now,” said Clemens Fuest, the president of the ifo Institute.

BondAdviser prefers PERLS 8, wary of Crown Notes

21 January 2021

A new report by BondAdviser, published through stockbrokers E.L & C Baillieu, has produced its latest list of preferred capital notes and bonds which trade on the ASX.

Commonwealth Bank PERLS 8 (ASX code: CBAPE) is its preferred credit security, stating it represents the “best value” of CBA’s several listed hybrid securities.

The report was put together last week, with the price of PERLS 8 finishing at $103.28 on Friday 15 January. By the close of close of business on 20 January, the price had slipped to $102.95, providing a 3.65% fully franked running yield and a trading margin of 1.92% over 3 month BBSW.

(As at 15/01/2021)

Other listed hybrids favoured by BondAviser/Baillieu include NAB Capital Notes (ASX code: NABPH), Australian Unity Bonds series C and D (ASX code: AYUHC, AYUHD) and Peet Bonds 2 (ASX code: PPCHB).

BondAviser/Baillieu have Crown Subordinated Notes 2 (ASX code: CWNHB) on their “Most Expensive” list, stating a breach of its lending covenants “seems likely”, leading to the possibility Crown will not “call” the notes on the 21 July 2021 first call date.

In late November 2020, Fitch Ratings stated it was applying “a 50% equity credit” to the Crown notes for the purposes of balance sheet ratio analysis. Fitch expects “the securities to remain a permanent feature of its capital structure, based on discussions with management.” A July call would seem unlikely should Crown’s notes remain a permanent part of Crown’s balance sheet.

Euro-zone consumer confidence continues at lacklustre level

21 January 2021

Summary: Euro-zone households more pessimistic in January; slightly below consensus expectation; still below long-term average; major euro-zone bond yields up.


EU consumer confidence plunged during the GFC and again in 2011/12 during the European debt crisis. After bouncing back through 2013 and 2014, it fell back significantly in late 2018 but only to a level which corresponds to significant optimism among households. Following the plunge which took place in April 2020, a recovery of sorts began in May. More recent readings have generally stagnated at below-average levels.

The January survey conducted by the European Commission indicated its Consumer Confidence index declined to -15.5. The reading was slightly less than the -15.0 which had been expected and lower than December’s figure of -13.8. The average reading since the beginning of 1985 has been -11.7.

Sovereign bond yields increased in major European bond markets as they digested comments made by ECB chief Christine Lagarde after the ECB’s latest policy meeting. By the end of the day, the German 10-year bund yield had gained 3bps to -0.50% while the French 10-year OAT bond yield finished 4bps higher at -0.27%.

Fall in Aust. consumer confidence “to be expected”

20 January 2021

Summary: Household sentiment softens; breaks four-month run of improvements; “still points to healthy consumer sentiment”; still well above long-term average; all index components lower;


After a lengthy divergence between measures of consumer sentiment and business confidence in Australia which began in 2014, confidence readings of the two sectors converged again around July 2018. Both readings then deteriorated gradually in trend terms, with consumer confidence leading the way. Household sentiment fell off a cliff in April but, after a few months of to-ing and fro-ing, it then staged a full recovery.

According to the latest Westpac-Melbourne Institute survey conducted in mid-January, household sentiment has deteriorated somewhat but remained quite robust. The Consumer Sentiment Index fell from December’s reading of 112.0 to 107.0, breaking a run of four consecutive months in which the index had increased.

Westpac chief economist Bill Evans said a pullback “was to be expected” given domestic border closures, clusters of infections in some states and rises in infections in the US and the UK. However, he noted the current reading “still points to healthy consumer sentiment.”


Treasury bond yields hardly moved on the day. By the close of business, the 3-year ACGB yields remained unchanged at 0.18%, the 10-year had slipped 1bp to 1.10% while the 20-year yield finished unchanged at 1.79%.

In the cash futures market, expectations of a change in the actual cash rate, currently at 0.03%, did not change materially. At the end of the day, contract prices implied the cash rate would trade in a range between 0.030% and 0.055% through to mid-2022.

Any reading below 100 indicates the number of consumers who are pessimistic is greater than the number of consumers who are optimistic. The latest figure is still substantially above the long-term average reading of just over 101.

All sub-indices were lower than a month ago, with the “12-month outlook” and the “5-year outlook” subindices recording “significant falls”.

“Trivial” decline in US consumer confidence

15 January 2021

Summary: US consumer confidence posts “trivial” decline in January; University of Michigan index slightly below consensus figure; vaccine news, expected fiscal programmes offset COVID deaths, protests.


US consumer confidence started 2020 at an elevated level. However, by March, surveys had begun to reflect a growing uneasiness with the global spread of COVID-19 and its reach into the US. After a plunge in April, US household confidence began to recover, albeit in a haphazard fashion.

The latest survey conducted by the University of Michigan indicates the average confidence level of US households deteriorated in January, maintaining its somewhat-erratic trend. The University’s preliminary reading from its Index of Consumer Sentiment registered 79.2, just below the generally expected figure of 79.5 and lower than December’s final figure of 80.7.

“Consumer sentiment posted trivial declines in early January despite the horrendous rise in COVID-19 deaths, the insurrection and the impeachment of Trump,” said the University’s Surveys of Consumers chief economist, Richard Curtin. Curtin noted “vaccines and a partisan shift in expectations due to the anticipated impact of Biden’s economic policies” had helped stem the decline.

Output jumps, capacity usage up in latest US report

15 January 2021

Summary: US output jumps in December; rise much higher than expected figure; capacity utilisation rate increases to mid-70s.


The Federal Reserve’s industrial production (IP) index measures real output from manufacturing, mining, electricity and gas company facilities located in the United States. These sectors are thought to be sensitive to consumer demand and so some leading indicators of GDP use industrial production figures as a component. Production began recovering in May and subsequent months after collapsing through March and April.

US industrial production jumped by 1.6% on a seasonally adjusted basis in December. The result was much higher than the 0.5% increase which had been generally expected but well above November’s 0.5% rise after it was revised up from 0.4%. On an annual basis, the contraction rate decreased from November’s revised figure of -5.4% to -3.6%.

The report was released on the same day as December industrial production figures and a January consumer confidence report and US Treasury bond yields moved lower on the day. By the end of the day, the 2-year Treasury yield had lost 3bps to 0.12% while 10-year and 30-year yields had each shed 4bps to 1.09% and 1.84% respectively.

The same report includes US capacity utilisation figures which are generally accepted as an indicator of future investment expenditure and/or inflationary pressures. Capacity usage had hit a high for the last business cycle in early 2019 before it began a downtrend which ended with April’s multi-decade low of 64.2%. December’s reading increased to 74.5% from  November’s revised figure of 73.4%.

Irish boost to euro-zone output in November

13 January 2021

Summary: Euro-zone industrial production jumps again; monthly figure much higher than consensus estimate; annual growth nearly back to zero; “uneven recovery across Europe”, huge rise in Irish output.


Following a recession in 2009/2010 and the debt-crisis which flowed from it, euro-zone industrial production recovered and then reached a peak four years later in early 2016. Growth rates then fluctuated through 2016/2017 before beginning a steady and persistent slowdown from the start of 2018. That decline was transformed into a plunge in March and April but the months which followed produced an almost-equally steep bounce.

According to the latest figures released by Eurostat, euro-zone industrial production jumped again in November, this time by 2.5% on a seasonally-adjusted basis. The rise was much higher than the 0.2% increase which had been generally expected and above October’s 2.3% increase after revisions. On an annual basis, the seasonally-adjusted growth rate increased from October’s revised rate of -3.3% to -0.7%*.

German and French 10-year sovereign bond yields moved lower despite the report, slightly outpacing US falls. By the close of business, the German 10-year bund yield had lost 5bps to -0.52% while the French 10-year OAT yield had shed 6bps to -0.32%.

ANZ economist John Bromhead said “the recovery in the index masks an uneven recovery across Europe.” Industrial production growth expanded in just one of the euro-zone’s largest economies. Germany’s production grew by 0.8% while the comparable figures for France, Spain and Italy were -0.9%, -0.6% and -1.4% respectively. Bromhead noted “much of this month’s gain was down to an enormous 52.8% rise in output in Ireland.”

As with other countries’ measures of industrial production, Eurostat’s industrial production index measures the output of industrial sectors in euro-zone countries on aggregate.

US core inflation stuck; Fed target “some time” away

13 January 2021

Summary: November US CPI up by 0.4%, in line with expectations; “core” rate up 0.1%, “remains subdued”; “some time” for underlying inflation to return to Fed’s 2% target; increase driven by higher fuel prices; used vehicles prices down.


The annual rate of US inflation as measured by changes in the consumer price index (CPI) halved from nearly 3% in the period from July 2018 to February 2019. It then fluctuated in a range from 1.5% to 2.0% through 2019 before rising above 2.0% in the final months of that year. Substantially lower rates were reported from March to May but subsequent reports indicated consumer inflation has largely returned to pre-pandemic levels.

The latest CPI figures released by the Bureau of Labor Statistics indicated seasonally-adjusted consumer prices rose by 0.4% on average in December. The result was in line with expectations but above November’s 0.2% increase. On a 12-month basis, the inflation rate ticked up from 1.2% to 1.3%.

“Headline” inflation is known to be volatile and so references are often made to “core” inflation for analytical purposes. Core inflation, a measure of inflation which strips out the volatile food and energy components of the index, increased by just 0.1% on a seasonally-adjusted basis for the month. This increase was also in line with expectations but lower than November’s comparable figure of 0.2%. The seasonally adjusted annual rate slipped back to 1.6% after ticking up to 1.7% in November.

“Overall core inflation remains subdued, though base effects will clearly see the year-on-year rate lift up due to the large price falls early in the pandemic,” said NAB economist Tapas Strickland.

ANZ economist John Bromhead noted prices of services were the main sources of “softness”. He said, “This is consistent with subdued underlying inflation pressures and imply that it will take time for it to return to the Fed’s 2.0% target.”

US Treasury bond yields fell on the day. By the close of business, the US 2-year yield had slipped 1bp to 0.14%, the 10-year yield had lost 4bps to 1.09% while the 30-year yield finished 5bps lower at 1.82%.

In terms of US Fed policy, expectations of any change in the federal funds range over the next 12 months remained fairly soft. January 2022 futures contracts implied an effective federal funds rate of 0.08%, just below the spot rate of 0.09%.

US quit rate unchanged as job openings fall, separations up

12 January 2021

Summary: US quit rate unchanged in November; job openings down by 1.6%, total separations up 5.3%; US Treasury yields slip.


The number of US employees who quit their jobs as a percentage of total employment increased slowly but steadily after the GFC. It peaked in March 2019 and then tracked sideways until virus containment measures were introduced in March 2020. The quit rate plummeted as alternative employment opportunities rapidly dried up but then recovered quite quickly over the next six months.

Figures released as part of the most recent JOLTS report show the quit rate remained unchanged. 2.2% of the non-farm workforce left their jobs voluntarily in November, the same rate as in September and October. The largest source of additional quits arose from the “Accommodation and food services” sector, while quits in the “Health care and social assistance” sector fell by a significant amount. Overall, the total number of quits for the month increased by 6,000 from October’s revised figure of 3.150 million to 3.156 million.

April’s non-farm payroll report indicated average hourly pay had spiked in that month, possibly the result of fewer lower-paid jobs relative to higher paying ones. Annual growth rates of subsequent months’ figures then fell back, hitting a recent low of 4.4% in November before accelerating to 5.1% in December.

Total vacancies at the end of November decreased by 105,000, or 1.6%, from October’s revised figure of 6.632 million to 6.527 million, driven by a 48,000 fall in the “Durable goods” sector and a 45,000 fall in the “Information” sector. 54,000 additional openings in the “Professional and business services” sector provided the single largest offset. Overall, 11 out of 18 sectors experienced fewer job openings than in the previous month.

Total separations during the same period increased by a net 271,000, or 5.3%, from October’s revised figure of 5.142 million to 5.413 million. The rise was led by the “Accommodation and food services” sector, where there were 326,000 more separations than in October. Separations increased in 10 out of 18 sectors.

Click for more news