News

Euro-zone output falls; Italy drags on expansion

12 November 2020

Summary: Euro-zone industrial production falls back in September; monthly figure significantly less than consensus estimate; annual rate still very negative; German, French Spanish production expands, Italy contracts.


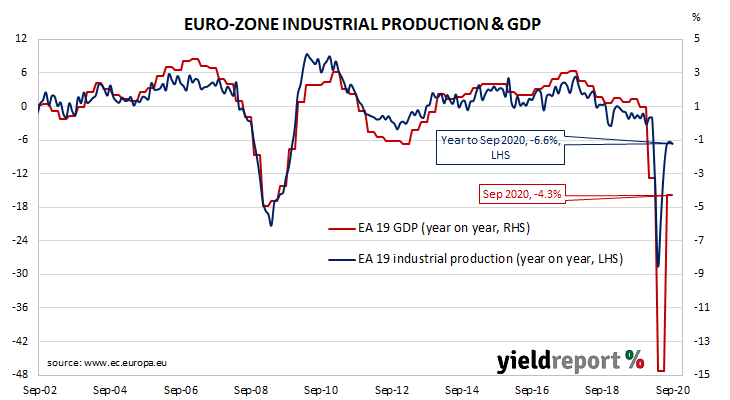
Following a recession in 2009/2010 and the debt-crisis which flowed from it, euro-zone industrial production recovered and then reached a peak four years later in early 2016. Growth rates then fluctuated through 2016/2017 before beginning a steady and persistent slowdown from the start of 2018. That decline was transformed into a plunge in March and April but the months which followed produced an almost-equally steep bounce.

According to the latest figures released by Eurostat, euro-zone industrial production contracted on a seasonally-adjusted basis by 0.4% in September. The fall was in contrast to the 0.6% increase which had been generally expected and August’s revised figure of +0.6%. On an annual basis, the seasonally-adjusted growth rate increased from August’s revised rate of -6.3% to -6.6%*.

German and French 10-year sovereign bond yields moved lower on the day. By the close of business, German and French 10-year yields had each shed 3bps to -0.54% and -0.29% respectively.

Industrial production growth generally expanded in the four largest euro-zone economies. Germany’s production grew by 1.7% in September while the comparable figures for France and Spain were 1.5% and 0.6% respectively. However, Italy’s production contracted by 5.6%, offsetting the gains of the other three countries.

As with other countries’ measures of industrial production, Eurostat’s industrial production index measures the output and activity of industrial sectors in euro-zone countries on aggregate.


* Eurostat’s published annual growth figures are calculated using index figures which are “calendar adjusted”, not “seasonally adjusted”. The published Eurostat figure was -6.8%.

Consumer confidence highest since 2013

11 November 2020

Summary: Household sentiment improves for third consecutive month; confidence index comfortably above long-term average; “another strong result; highest since November 2013; index surges in Victoria; all but one components higher; unemployment index higher, respondents expect higher jobless rate


After a lengthy divergence between measures of consumer sentiment and business confidence in Australia which began in 2014, confidence readings of the two sectors converged again around July 2018. Both readings then deteriorated gradually in trend terms, with consumer confidence leading the way. Household sentiment fell off a cliff in April but, after a few months of to-ing and fro-ing, then staged a considerable recovery.

According to the latest Westpac-Melbourne Institute survey conducted in early November, household sentiment has improved to a reasonably optimistic level. The Consumer Sentiment Index rose for a third consecutive month, from October’s reading of 105.0 to 107.7.

“This is another strong result,” said Westpac chief economist Bill Evans.

Local Treasury bond yields rose noticeably at the long end, outrunning overnight increases of US Treasury yields. By the end of the day, the 3-year ACGB yield had crept up 1bps to 0.19%, the 10-year yield had increased by 8bps to 1.00% while 20-year yields finished 6bps higher at 1.63%.

In the cash futures market, expectations of a change in the actual cash rate, currently at 0.04%, did not change materially. At the end of the day, contract prices implied the cash rate would trade in a range between 0.03% and 0.04% through to the end of 2021.

Any reading below 100 indicates the number of consumers who are pessimistic is greater than the number of consumers who are optimistic. The latest figure is the highest since November 2013, substantially above the long-term average reading of just over 101.

Evans noted Victoria was the “standout” in terms of higher confidence levels. However, confidence partially retreated in New South Wales following a surge there in October’s survey.

All sub-indices were higher than a month ago with the exception of the “family finances versus a year ago” sub-index. Also, the Index of Unemployment Expectations increased, indicating “more respondents expect the unemployment rate to rise.”

US quit rate up, openings to become focus in 2021

10 November 2020

Summary: US quit rate rises; job openings up, total separations down; policy makers to watch job openings “closely in early 2021”.


The number of US employees who quit their jobs as a percentage of total employment increased slowly but steadily after the GFC. It peaked in March 2019 and then tracked sideways until virus containment measures were introduced in March 2020. Quit rates plummeted as alternative employment opportunities rapidly dried up, followed by a sharp but partial recovery over the next few months. The trend has been more gradual recently.

Figures released as part of the most recent JOLTS report show the quit rate rose following a dip in the previous month. 2.1% of the non-farm workforce left their jobs voluntarily in September, an increase from August’s comparable figure of 2.0%. The largest source of additional quits arose from the “Other services”, “Professional and business services” and construction sectors while the “Retail trade” sector experienced fewer quits. Overall, the total number of quits for the month increased by 179,000 from August’s revised figure of 2.839 million to 3.018 million.

April’s non-farm payroll report indicated average hourly pay had spiked in that month, possibly the result of fewer lower-paid jobs relative to higher paying ones. Subsequent months’ figures then saw falls in average hourly pay, with a corresponding fall in the annual growth rate from 8.0% in April to 4.5% in October.

Total vacancies at the end of September increased by 84,000, or 1.3%, from August’s revised figure of 6.352 million to 6.436 million, driven by rises in the “Professional and business services”, “Transportation, warehousing, and utilities” and “Health care and social assistance” sectors. Fewer openings in the “Retail trade” and construction sectors provided some offsetting effects. Overall, 12 out of 18 sectors experienced more job openings than in the previous month.

Total separations during the same period decreased by a net 25,000 from August’s revised figure of 4.689 million to 4.664 million. The fall was led by the “Retail trade” and construction sectors, where there were respectively 64,000 fewer separations than in August while the “Other services” sector was the largest source of increased separations. Separations decreased in 7 of 18 sectors but they were collectively larger.

Cautious response to improved business conditions, confidence levels

10 November 2020

Summary: Business conditions, confidence improve; conditions in NSW, Victoria see “significant” gains, smaller states pull back; improved confidence still “fragile”; capacity usage resumes improving; “several reasons to be cautious”.


NAB’s business survey indicated Australian business conditions were robust in the first half of 2018, with a cyclical-peak reached in April of that year. Readings from NAB’s indices then began to slip, declining to below-average levels by the end of 2018. Forecasts of a slowdown in the domestic economy began to emerge in the first half of 2019 and the indices trended lower, hitting a nadir in April 2020 as pandemic restrictions were introduced. Conditions have improved markedly since then.

According to NAB’s latest monthly business survey of over 400 firms conducted in the last week of October, business conditions improved for a second consecutive month. NAB’s conditions index registered 1, up from September’s reading of zero.

“The recovery in business conditions has been uneven across states; the smaller states have generally seen a stronger recovery in conditions than Victoria and New South Wales. However, October saw a small reversal in this trend, with Victoria and New South Wales seeing significant gains, while the remaining states pulled back,” said NAB chief economist Alan Oster.

Business confidence improved for a third consecutive month. NAB’s confidence index rose from September’s reading of -4 to +5. Typically, NAB’s confidence index leads the conditions index by approximately one month, although some divergences have appeared in the past from time to time.

Oster said, “The improvement in confidence is encouraging but remains fragile, and it will likely remain that way until a vaccine is available. In the interim, confidence will be an important factor for how quickly businesses expand employment and capex as demand normalises.”

Commonwealth bond yields jumped, following large movements overnight in US Treasury yields. By the end of the day, the 3-year ACGB yield had gained 3bps to 0.18%, the 10-year yield had increased by 15bps to 0.92% while the 20-year yield finished 17bps higher at 1.57%.

US jobless rate below 7% in October

06 November 2020

Summary: October non-farm payrolls increase by over 600,000; jobless rate drops considerably again despite higher participation rate; “a good set of numbers”; stimulus package “less likely” in final months of Trump Administration; employment-to-population ratio up for sixth consecutive month; underemployment rate down again, still in low-teens; long-term unemployment continues rise.


The US economy ceased producing jobs in net terms as infection controls began to be implemented in March. The unemployment rate had been around 3.5% but that changed as job losses began to surge through March and April. May’s non-farm employment report represented a turning point and subsequent months have continued to provide substantial employment gains.

According to the US Bureau of Labor Statistics, the US economy created an additional 0.638 million jobs in the non-farm sector in October. The increase was slightly above the 0.610 million which had been generally expected but a little less than the 0.672 million jobs which had been added in September after revisions. Employment figures for August and September were revised up by a total of 15,000.

The unemployment rate dropped significantly for a second month, from September’s rate of 7.9% to 6.9%. The total number of unemployed decreased by 1.519 million to 11.061 million while the total number of people who are either employed or looking for work increased by 724,000 to 160.867 million. The rise in the number of people in the labour force increased the participation rate from September’s rate of 61.4% to 61.7%.

NAB economist Tapas Strickland said the figures were “a good set of numbers for sure but with two important implications.” He said an agreement on the latest US stimulus package was “less likely” in the last two months of the Trump Administration and the numbers are dated “given the resurgence in virus numbers and higher frequency data showing consumers are self-isolating even where restrictions have not been tightened greatly.”

Long-term US Treasury yields moved higher on the day. By the close of business, the 10-year US Treasury bond yield had gained 5bps to 0.82% and the 30-year yield had increased by 7bps to 1.60%. The 2-year bond yield finished 1bp higher at 0.16%.

One figure which is indicative of the “spare capacity” of the US employment market is the employment-to-population ratio. This ratio is simply the number of people in work divided by the total US population. It hit a cyclical-low of 58.2 in October 2010 before slowly recovering to just above 61% in late-2019. October’s reading increased for a sixth consecutive month from 56.6% in September to 57.4%.

ADP report points to “slowing employment growth” in US

04 November 2020

Summary: ADP payroll numbers increase in October; half of the consensus figure; September number revised up a touch; report “points to slowing employment growth”; figures up across firms of all sizes; services sector accounts for 95% of gains.


The ADP National Employment Report is a monthly report which provides an estimate of US non-farm employment in the private sector. Since the report began to be published in 2006, its employment figures have exhibited a high correlation with official non-farm payroll figures, although a large difference can arise in any individual month.

The ADP October report indicated private sector employment increased by 0.365 million, half the 0.738 million which had been generally expected. September’s increase was revised up by 2,000 to 753,000.

NAB Head of FX Strategy within its FICC division Ray Attrill said the report “points to slowing employment growth.”

US Treasury yields fell by increasing amounts along the curve but this may have been more a function of uncertainty surrounding the US presidential election than the ADP report. By the close of business, the 2-year Treasury bond yield had lost 2bps to 0.14%, the 10-year yield had dropped 9bps to 0.77% while the 30-year yield finished 8bps lower at 1.54%.

Employment numbers in net terms increased almost evenly across businesses of all sizes. Firms with less than 50 employees filled a net 114,000 positions, mid-sized firms (50-499 employees) gained 135,000 positions while large businesses (500 or more employees) accounted for 116,000 additional employees.

Employment at service providers accounted for around 95% of the total net increase, or 348,000 positions. The “Leisure & Hospitality” sector was the largest single source of gains, with 125,000 additional positions filled while the “Education & Health” and “Professional & Business” sectors accounted for around 79,000 and 60,000 positions respectively. Total jobs among goods producers increased by a net 17,000.

Prior to the ADP report, the consensus estimate of the change in October’s non-farm employment figure was 0.610 million. The non-farm payroll report will be released by the Bureau of Labor Statistics this coming Friday night (AEST), 6 November 2020.

ISM PMI report indicates “strong momentum at the start of Q4”

02 November 2020

Summary: ISM purchasing managers index (PMI) up; reading well above consensus expectation; “strong momentum at the start of Q4”; reading implies US economy growing at solid pace.


US purchasing managers’ index (PMI) readings reached a cyclical peak in September 2017 before they started a downtrend which stabilised in late 2019 after a truce of sorts was made with the Chinese regarding trade. March’s report signalled a contraction in US manufacturing activity had begun; it stayed in this state until June.

According to the latest Institute of Supply Management (ISM) survey, its Purchasing Managers Index recorded a reading of 59.3% in October. The result was well above the expected figure of 55.6% and higher than September’s reading of 55.4%. The average reading since 1948 is 52.9% and any reading above 50% implies an expansion in the manufacturing sector. A reading “above 42.8%, over a period of time, generally indicates an expansion of the overall economy,” according to the ISM.

ANZ senior economist Felicity Emmett said the rise pointed “to strong momentum at the start of Q4.”

US Treasury bond yields reacted in a mixed fashion on the day. By the close of business, the 2-year Treasury bond yield had slipped 1bp to 0.16%, the 10-year yield had shed 2bps to 0.86% but the 30-year yield finished 6bps higher at 1.66%.

Purchasing Managers’ Indices (PMIs) are economic indicators derived from monthly surveys of executives in private-sector companies. They are diffusion indices, which means a reading of 50% represents no change from the previous period, while a reading under 50% implies respondents reported a deterioration on average. They are particularly useful as a leading indicator.

Manufacturing PMI figures appear to lead US GDP by several months despite a considerable error in any given month. The chart below shows US GDP on a “year on year” basis (and not the BEA annualised basis) against US GDP implied by monthly PMI figures.

Gov, RBA “policy support” buoy home loan approvals

02 November 2020

Summary: Home loan approvals increase in number, value in September; “Homebuilder”, first buyer deposit scheme, RBA rate guidance “buoy confidence”; owner-occupier, investor loan commitments up again; loan activity including refinancing “only a smidge below previous record high.


A very clear downtrend was evident in the monthly figures of both the number and value of home loan commitments through late-2017 to mid-2019. Then the RBA reduced its cash rate target in a series of cuts and both the number and value of mortgage approvals began to noticeably increase. Figures from February through to May provided an indication the trend had finished but the last four sets of figures contradict this idea.

September’s housing finance figures have now been released and the total number of loan commitments (excluding refinancing loans) to owner-occupiers leaped by 27.1%. The gain came after a 22.9% jump in August after revisions and, on an annual basis, the rate of growth increased from August’s figure of 34.0% to 69.2%.

“Policy support for housing construction including Homebuilder, the first buyer deposit scheme and forward guidance on rates from the RBA seems to have buoyed confidence for housing from investors and occupiers alike,” said ANZ economist Adelaide Timbrell.

The figures came out on the same day as the latest Westpac-Melbourne Institute Inflation Gauge, ANZ’s October Job Ads survey and the September home approvals report. Commonwealth bond yields moved lower, ignoring higher US Treasury yields at the close of trading on Friday night. By the end of the day, the 3-year ACGB yield had lost 2bps to 0.15%, the 10-year yield had shed 5bps to 0.78% while the 20-year yield finished 4bps lower at 1.40%.

In dollar terms, total loan approvals excluding refinancing increased by 5.9% over the month, down from August’s 12.6% increase after revisions. On a year-on-year basis, total approvals excluding refinancing increased by 25.5%, an acceleration from the previous month’s comparable figure of 19.3%.

The total value of owner-occupier loan commitments excluding refinancing increased by 6.0%, less than August’s revised figure of 13.6%. On an annual basis, owner-occupier loan commitments were 33.8% higher than in September 2019, whereas August’s annual growth figure was 29.2%.

Job ads continue rising in October

02 November 2020

Summary:  Job ads increase in October significant again; still 16.2% lower than in October 2019; declining fiscal support may not effect ad numbers as much as jobless numbers; implies falling jobless rate.


From mid-2017 onwards, year-on-year growth rates in the total number of Australian job advertisements consistently exceeded 10%. That was until mid-2018 when the annual growth rate fell back markedly. 2019 was notable for its reduced employment advertising and this trend continued into the first quarter of 2020. Figures plunged in April as pandemic restrictions took effect but subsequent reports have provided evidence a recovery is taking place.

According to the latest ANZ figures, total advertisements increased by 9.4% in October on a seasonally-adjusted basis. The rise followed an 8.3% increase in September and a 2.8% gain in August after revisions. However, on a 12-month basis, total job advertisements were still 16.2% lower than in October 2019, up from September comparable figure of -24.7%. The figures came out on the same day as the latest Westpac-Melbourne Institute Inflation Gauge and September housing finance approvals. Commonwealth bond yields moved lower, ignoring higher US Treasury yields at the close of trading on Friday night. By the end of the day, the 3-year ACGB yield had lost 2bps to 0.15%, the 10-year yield had shed 5bps to 0.78% while the 20-year yield finished 4bps lower at 1.40%.

Inflation estimate slips in October

02 November 2020

Summary: Melbourne Institute inflation index slips in October; annual rate down to 1.1%.


Despite the RBA’s desire for a higher inflation rate, ostensibly to combat recessions, attempts to accelerate inflation through record-low interest rates have failed to date. The RBA’s stated objective is to achieve an inflation rate of between 2% and 3%, “on average, over time.” Since the GFC, Australia’s inflation rate has been trending lower and lower; the “coronavirus recession” then crushed it in the June quarter.

The Melbourne Institute’s latest Inflation Gauge index slipped 0.1% in October. The decline follows 0.1% rises in September and August and a 0.9% jump in July. On an annual basis, the index rose by 1.1%, down from 1.3%.

The figures came out on the same day as ANZ’s October Job Ads report and September housing finance approvals. Commonwealth bond yields moved lower, ignoring higher US Treasury yields at the close of trading on Friday night. By the end of the day, the 3-year ACGB yield had lost 2bps to 0.15%, the 10-year yield had shed 5bps to 0.78% while the 20-year yield finished 4bps lower at 1.40%.

The Melbourne Institute’s Inflation Gauge is an attempt to replicate the ABS consumer price index (CPI) on a monthly basis. It has turned out to be a reliable leading indicator of the CPI, although there are periods in which the Inflation Gauge and the CPI have diverged for as long as twelve months. On average, the Inflation Gauge’s annual rate tends to overestimate the ABS headline rate by an average of a little under 0.1%.

Central bankers desire a certain level of inflation which is “sufficiently low that it does not materially distort economic decisions in the community” but high enough so it does not constrain “a central bank’s ability to combat recessions.” Hence the obsession among central bankers to increase inflation.

Click for more news