News

Leading index back to pre-pandemic level

21 October 2020

Summary:  Leading index improves substantially for second consecutive month in September; reading in line with 12-month average prior to the pandemic; index reading implies annual GDP growth to rise to around +2.25% later this year/early next year; RBA forecast implies 1.3% growth in second half of 2020.


Westpac and the Melbourne Institute describe their Leading Index as a composite measure which attempts to estimate the likely pace of Australian economic growth over the next three to six months. After reaching a peak in early 2018, the index trended lower through 2018, 2019 and the early months of 2020 before plunging to recessionary levels in the second quarter. Readings from the third quarter have been markedly higher.

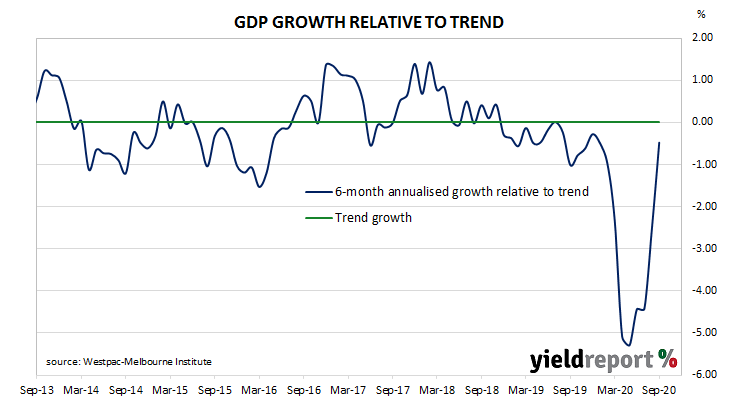
The latest reading of the six month annualised growth rate of the indicator increased substantially, from August’s revised figure of –2.28% to -0.48% in September.

“While the index growth rate remains negative, it is now well above the lows seen in the first half of the year when the COVID shock saw it drop well below –5%. Indeed, at –0.48%, the latest reading is in line with the average recorded over the twelve months prior to the pandemic,” said Westpac chief economist Bill Evans.

Index figures represent rates relative to trend-GDP growth, which is generally thought to be around 2.75% per annum. The index is said to lead GDP by three to six months, so theoretically the current reading represents an annualised GDP growth rate of around 2.25% in the last quarter of 2020 and/or the first quarter of 2021.

Long-term Commonwealth Government bond yields moved noticeably higher. By the end of the day, 10-year and 20-year ACGB yields both had each increased by 5bps to 0.81% and 1.41% respectively. The 3-year yield remained unchanged at 0.17%.

In the cash futures market, expectations of a change in the actual cash rate, currently at 0.13%, continued to favour a slight easing. At the end of the day, contract prices implied the cash rate would fall below 0.10% in November and then decline a little further before trickling down to 0.035% by mid-2021.

In his opening statement to the House of Representatives Standing Committee on Economics on 14 August, RBA chief Philip Lowe said he expected GDP to contract by 6% over the 2020 calendar year. Taking into account a 7.2% contraction in the first half of 2020, a 6% contraction over the full year implies growth of 1.3% in the second half. Evans expects growth in both the September and December quarters to “be clearly in positive territory…”

US September output raises “faltering recovery” concerns

16 October 2020

Summary: US output declines after fourth months of gains; contraction in contrast to expected expansion; “concerns of a faltering recovery”; capacity utilisation decreases after August number revised up.


The Federal Reserve’s industrial production (IP) index measures real output from manufacturing, mining, electricity and gas company facilities located in the United States. These sectors are thought to be sensitive to consumer demand and so some leading indicators of GDP use industrial production figures as a component.

Production began recovering in May and subsequent months after collapsing through March and April.

US industrial production contracted by 0.6% on a seasonally adjusted basis in September, the first decline in the last five reported months. The result was in contrast to the 0.6% expansion which had been generally expected and August’s 0.4% increase. On an annual basis, the contraction rate increased from August’s revised figure of -7.0% to -7.3%.

Westpac senior economist Elliot Clarke said the report raised “concerns of a faltering recovery.” He noted “weakness in the auto sector and electronics led the set-back.”

The report was released on the same day as September retail sales figures and the University of Michigan’s latest consumer sentiment report. US Treasury bond yields were largely unchanged and, by the end of the day, 2-year and 10-year Treasury yields remained unchanged at 0.14% and 0.74% respectively while the 30-year yield finished 1bp higher at 1.53%.

Consumer spending “very strong” in US at end of Sep quarter

16 October 2020

Summary:  US retail sales increase for fifth consecutive month; rise nearly triple expected figure; largest monthly rise since September 2017 excluding “wild” gyrations in second quarter; US consumer spending “very strong” at end of Q3; all but one category segments increase sales over month; “vehicles and parts suppliers” the largest influence on total; economists still doubtful of “durability of the rebound”.


US retail sales had been trending up since late 2015 but, commencing in late 2018, a series of weak or negative monthly results led to a drop-off in the annual growth rate below 2.0% by the end of that year. Growth rates then increased in trend terms through 2019 and into early 2020 until pandemic restrictions sent it into negative territory. A “v-shaped” recovery has since taken place.

According to the latest “advance” sales numbers released by the US Census Bureau, total retail sales increased by 1.9% in September. The gain was nearly triple the 0.7% increase which had been generally expected and considerably more than the 0.6% rise after revisions in August. On an annual basis, the growth rate increased from August’s revised rate of 2.8% to 5.4%.

“Aside from the wild monthly gyrations in the initial months of the pandemic, this is the largest monthly rise since September 2017,” said NAB currency strategist Rodrigo Catril.

The report was released on the same day as August industrial production numbers and the University of Michigan’s latest consumer sentiment report. US Treasury bond yields were largely unchanged and, by the end of the day, 2-year and 10-year Treasury yields remained unchanged at 0.14% and 0.74% respectively while the 30-year yield finished 1bp higher at 1.53%.

“The data suggest the US consumer remained very strong at the end of Q3 despite uncertainty about additional pandemic stimulus,” said ANZ economist Hayden Dimes.

All but one segment increased sales over the month, with the “Motor vehicles and parts suppliers” segment providing the largest influence on the overall result. Sales in this segment increased by 3.6% over the month. The “Clothing and accessories stores” segment also had a notable influence, with sales in this segment rising by 11.0%.

US consumers slightly more confident; current conditions offset by future prospect

16 October 2020

Summary: US consumer confidence up again in October; University of Michigan index higher than expected; concerns regarding current conditions “largely offset” by views of economic prospects.


US consumer confidence started 2020 at an elevated level. However, by March, surveys had begun to reflect a growing uneasiness with the global spread of COVID-19 and its reach into the US. After a plunge in April, US household confidence began to recover, albeit in a haphazard fashion.

The latest survey conducted by the University of Michigan indicates the average confidence level of US households improved modestly while remaining at a level under the long-term average in October. The University’s preliminary reading from its Index of Consumer Sentiment registered 81.2, more than the generally expected figure of 80.0 and a little higher than September’s final figure of 80.4.

“Slowing employment growth, the resurgence in COVID-19 infections and the absence of additional federal relief payments prompted consumers to become more concerned about the current economic conditions. Those concerns were largely offset by continued small gains in economic prospects for the year ahead,” said the University’s Surveys of Consumers chief economist, Richard Curtin.

The report was released on the same day as September retail sales figures and the August industrial production numbers. US Treasury bond yields were largely unchanged and, by the end of the day, 2-year and 10-year Treasury yields remained unchanged at 0.14% and 0.74% respectively while the 30-year yield finished 1bp higher at 1.53%.

Less-confident households are generally inclined to spend less and save more; some drop-off in household spending could be expected to follow. As private consumption expenditures account for a majority of GDP in advanced economies, a lower rate of household spending growth would flow through to lower GDP growth if other GDP components did not compensate.

Higher US producer prices “not enough to fuel inflation”

14 October 2020

Summary: Prices received by producers increase by 0.4% on average in September; rise noticeably higher than expected; annual “core” PPI rate doubles (from low base); long-term US bond yields unchanged on day; PPI rise driven equally by goods and services prices.


Around the end of 2018, the annual inflation rate of the US producer price index (PPI) began a downtrend which then continued through 2019. Months in which prices received by producers increased suggested the trend may have been coming to an end, only for it to continue, culminating in a plunge in April. Figures from subsequent months suggest a return to “normal” may be taking place.

The latest figures published by the Bureau of Labor Statistics indicate producer prices rose by 0.4% after seasonal adjustments in September. The increase was noticeably above the 0.1% rise which had been generally expected and a little higher than August’s 0.3% rise. On a 12-month basis, the rate of producer price inflation after seasonal adjustments increased to 0.5%, up from the -0.2% annual rate recorded in August.

“PPI inflation is still adjusting to the volatility of the COVID-19 crisis, but at 0.4% is not enough to fuel inflation,” said ANZ economist John Bromhead.

PPI inflation excluding foods and energy rose by 0.4% after recording increases of 0.4% in August and 0.5% in July. The annual rate doubled from August’s 0.6% to 1.2%. US Treasury bond yields were unresponsive to the report. By the end of the day, 2-year, 10-year and 30-year yields were all unchanged at 0.14%, 0.73% and 1.51% respectively.

The BLS stated higher prices for final demand services accounted for two-thirds of the month’s increase after they rose by 0.4% on average. Prices of goods also increased by 0.4% on average.

Output up in euro-zone; Germany, Spain lag

14 October 2020

Summary: Euro-zone industrial production continues recovery after huge falls in March, April; monthly figure significantly more than consensus estimate; annual rate still very negative; German and Spanish production contract.


Following a recession in 2009/2010 and the debt-crisis of 2010-2012 which flowed from it, euro-zone industrial production recovered and then reached a peak four years later in early-2016. Growth rates then fell and recovered through 2016/2017 before beginning a steady and persistent slowdown from the start of 2018. That decline was transformed into a plunge in March and April. However, the months following have produced an almost-equally steep bounce.

According to the latest figures released by Eurostat, euro-zone industrial production expanded on a seasonally-adjusted basis by 0.7% in August. The increase was less than the 0.8% increase which had been generally expected and substantially less than July’s revised figure of 5.0%. On an annual basis, the seasonally-adjusted growth rate increased from July’s revised rate of -7.0% to -6.5%*.

German and French 10-year sovereign bond yields moved lower on the day. By the close of business, German and French 10-year yields had each shed 2bps to -0.58% and -0.31% respectively.

Industrial production growth proved to be patchy among the four largest euro-zone economies. Germany’s production contracted by 0.2% in August while the comparable figures for France, Spain and Italy were 1.3%, -0.2% and 7.7% respectively.

As with other countries’ measures of industrial production, Eurostat’s industrial production index measures the output and activity of industrial sectors in euro-zone countries on aggregate.


* Eurostat’s published annual growth figures are calculated using index figures which are “calendar adjusted”, not “seasonally adjusted”. The published Eurostat figure was -7.2%.

“An extraordinary result”: consumer sentiment jumps

14 October 2020

Summary: Household sentiment improves significantly for second consecutive month; confidence index back to above long-term average; “an extraordinary result”; at level last seen in late 2018; index higher in all states, all components higher; “stunning lift” in job security confidence.


After a lengthy divergence between measures of consumer sentiment and business confidence in Australia which began in 2014, confidence readings of the two sectors converged again around July 2018. Both readings then deteriorated gradually in trend terms, with consumer confidence leading the way. Household sentiment fell off a cliff in April but, after a few months of to-ing and fro-ing, then staged a considerable recovery.

According to the latest Westpac-Melbourne Institute survey conducted in early October, household sentiment has increased markedly. The Consumer Sentiment Index jumped for a second consecutive month, this time from September’s 93.8 to 105.0, taking it back to above-average levels.

“This is an extraordinary result,” said Westpac chief economist Bill Evans.

Local Treasury bond yields rose a touch at the short end but declined a little elsewhere. By the end of the day, the 3-year ACGB yield had crept up 1bps to 0.19% while 10-year and 20-year yields both finished 1bp lower at 0.84% and 1.43% respectively.

In the cash futures market, expectations of a change in the actual cash rate, currently at 0.13%, continued to favour a slight easing. At the end of the day, contract prices implied the cash rate would trade in a range between 0.06% and 0.08% through to the end of 2021.

Any reading below 100 indicates the number of consumers who are pessimistic is greater than the number of consumers who are optimistic. The latest figure has moved back to levels last seen in late 2018, above the long-term average reading of just over 101.

Evans noted confidence had increased in all states and all components of the index were higher. He also noted “a stunning lift in confidence around job security.”

US inflation rise as expected; most components “soft”

13 October 2020

Summary:  September CPI increase in line with expected figure; headline and core figures rise by same amounts; rents, most index components “soft”, “sharp lift” in used vehicle prices.


The annual rate of US inflation as measured by changes in the consumer price index (CPI) halved from nearly 3% in the period from July 2018 to February 2019. It then fluctuated in a range from 1.5% to 2.0% through 2019 before rising above 2.0% in the final months of that year. “Headline” inflation is known to be volatile and so references are often made to “core” inflation for analytical purposes. Substantially lower rates for both measures were reported from March to May but recent reports indicate consumer inflation has largely returned to pre-pandemic levels.

The latest CPI figures released by the Bureau of Labor Statistics indicated seasonally-adjusted consumer prices increased by 0.2% on average in September. The rise was in line with the expected figure but less than August’s 0.4% increase. On a 12-month basis, the inflation rate ticked up from August’s rate of 1.3% to 1.4%.

Core inflation, a measure of inflation which strips out the volatile food and energy components of the index, also increased on a seasonally-adjusted basis by 0.2% for the month. The increase was in line with the 0.2% rise which had been expected but lower than August’s comparable figure of 0.4%. The seasonally adjusted annual rate remained unchanged at 1.7%.

“Rents are falling and most index components were soft, the exception being a sharp lift in used car prices,” said ANZ senior economist Catherine Birch.

US Treasury bond yields fell by increasing amounts across the curve. By the end of the day, the US 2-year yield had slipped 1bp to 0.14%, the 10-year yield had shed 5bps to 0.73% while the 30-year yield finished 6bps lower at 1.51%.

In terms of US Fed policy, expectations of any change in the federal funds range over the next 12 months remained fairly soft. November futures contracts implied an effective federal funds rate of 0.085%, just under the spot rate of 0.09%.

Home loan approvals unexpectedly jump; housing “much more resilient”

09 October 2020

Summary: Home loan approvals jump in number and value in August; no Victorian impact; housing “much more resilient” than expected; owner-occupier loan commitments surge again; investor commitments also up strongly; “widening state variations”, lags between application and approval complicating forecasting.


A very clear downtrend was evident in the monthly figures of both the number and value of home loan commitments through late-2017 to mid-2019. Then the RBA reduced its cash rate target in a series of cuts and both the number and value of mortgage approvals began to noticeably increase. Figures from February through to May provided an indication the trend had finished but the last three sets of figures contradict this idea.

August’s housing finance figures have now been released and the total number of loan commitments (excluding refinancing loans) to owner-occupiers jumped by 22.9%. The gain came after a 9.0% rise in July after revisions and, on an annual basis, the rate of growth increased from July’s figure of 7.8% to +34.0%.

“For the August month, finance approvals show no impact whatsoever from Victoria’s ‘second wave’ lockdown that began in the month, the state instead posting a strong 13.9% gain in line with that seen nationally,” said Westpac senior economist Matthew Hassan.

Local Treasury bond yields fell modestly. By the end of the day, the 3-year ACGB yield remained unchanged at 0.18%, the 10-year yield had slipped 1bp to 0.86% while the 20-year yield finished 2bps lower at 1.44%.

Up one month, down the next: US quits, separations, openings all fall

06 October 2020

Summary: US quit rate falls after rising for three months; job openings, total separations also down; twice as many jobless as openings.


The number of US employees who quit their jobs as a percentage of total employment increased slowly but steadily after the GFC. It peaked in March 2019 and then tracked sideways until virus containment measures were introduced in March 2020. Quit rates plummeted as alternative employment opportunities rapidly dried up. A rapid recovery then took place over the next few months.

Figures released as part of the most recent JOLTS report show the quit rate fell after rising for the previous three months. 2.0% of the non-farm workforce left their jobs voluntarily in August, a decline from July’s comparable figure of 2.1%. The largest source of fewer quits arose from the “Other services” and construction sectors while the “Finance and insurance” sector experienced a greater number of quits. Overall, the total number of quits for the month decreased from July’s revised figure of 2.932 million to 2.793 million.

April’s non-farm payroll report indicated average hourly pay had spiked, possibly the result of fewer lower-paid jobs relative to higher paying ones. Subsequent months’ figures then saw falls in average hourly pay, with a corresponding fall in the annual growth rate from 8.0% in April to 4.7% in September.

Total vacancies at the end of August decreased by 204,000, or 3.0%, from July’s revised figure of 6.697 million to 6.493 million, driven by falls in the “Health care and social assistance”, construction and “Retail trade” sectors. Increased openings in the “State and local government” and, to a lesser extent, the “Accommodation and food services” sectors provided some offsetting effects. Overall, 11 out of 18 sectors experienced fewer job openings than in the previous month.

Total separations during the same period decreased by 394,000 from July’s revised figure of 4.988 million to 4.594 million. The change was led by the “Professional and business services” sector, where there were 102,000 fewer separations than in July. Separations increased in 6 of 18 sectors but they were all quite small individually.

“There are currently twice as many unemployed compared to jobs available,” noted ANZ senior economist Catherine Birch.

Click for more news