News

“Positive news” from September job ads

06 October 2020

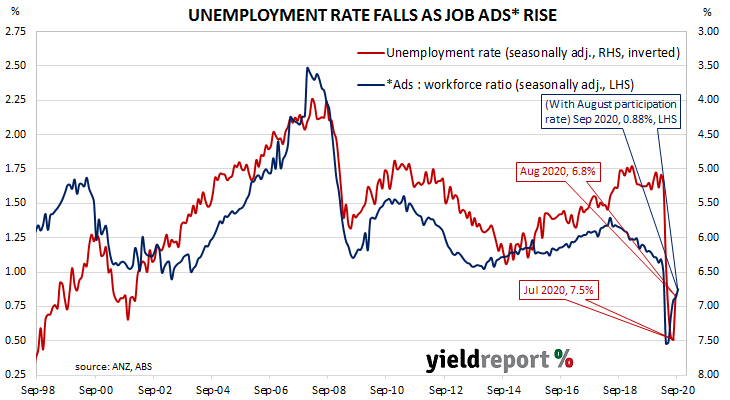
Summary:  Job ads increase significantly in September; number of weekly ads increase through month; implies falling jobless rate.


From mid-2017 onwards, year-on-year growth rates in the total number of Australian job advertisements consistently exceeded 10%. That was until mid-2018 when the annual growth rate fell back markedly. 2019 was notable for its reduced employment advertising and this trend continued into the first quarter of 2020. Figures plunged in April as pandemic restrictions took effect but subsequent reports have provided evidence a recovery is taking place.

According to the latest ANZ figures, total advertisements increased by 7.8% in September on a seasonally-adjusted basis. The rise followed a 2.6% increase in August and an 18.7% jump in July after revisions. However, on a 12-month basis, total job advertisements were still 24.8% lower than in September 2019, up from August’s comparable figure of -29.9%.

“There were week-to-week gains throughout the month, which was positive news given the ongoing restrictions in Victoria,” said ANZ senior economist Catherine Birch.

Longer-term Commonwealth bond yields moved higher while short-term yields eased, with the then upcoming 2020/21 Budget and RBA Board meeting weighing on local markets. By the end of the day, the 10-year ACGB yield had inched up 1bp to 0.89% while the 20-year yield finished 5bps higher at 1.47%. The 3-year yield lost 2bps to 0.20%.

The inverse relationship between job advertisements and the unemployment rate has been quite strong (see below chart), although ANZ themselves called the relationship between the two series into question in early 2019.  A rising number of job advertisements as a proportion of the labour force is suggestive of lower unemployment rates in the near-future. A falling ratio suggests higher unemployment rates will follow.

“Notably weak” business conditions in Victoria; some states now above average

05 October 2020

Summary: Business conditions, confidence improve; conditions “notably weaker” in Victoria, some states now above average; capacity usage rises after August reversal; forward-looking indicators “soft”.


NAB’s business survey indicated Australian business conditions were robust in the first half of 2018, with a cyclical-peak reached in April of that year. Readings from NAB’s indices then began to slip, declining to below-average levels by the end of 2018. Forecasts of a slowdown in the domestic economy began to emerge in the first half of 2019 and the indices trended lower, hitting a nadir in April 2020 as pandemic restrictions were introduced. Conditions have improved markedly since then.

According to NAB’s latest monthly business survey of over 400 firms conducted in the middle of September, business conditions recovered all of August’s deterioration. NAB’s conditions index registered 0, up from August’s reading of -6.

Business confidence improved for a second consecutive month. NAB’s confidence index rose from August’s reading of -8 to -4. Typically, NAB’s confidence index leads the conditions index by approximately one month, although some divergences have appeared in the past from time to time.

“The impact of the virus remains evident in Victoria where conditions are notably weaker than the other states. On the other hand, conditions are now above average in Western Australia, South Australia and Queensland pointing to an ongoing recovery in those states. New South Wales remains negative but also improved in the month,” said NAB chief economist Alan Oster.

NAB’s report came out on the same day as the Melbourne Institute’s latest Inflation Gauge release and Commonwealth bond yields moved higher, to some degree following US Treasury yields in overnight trading. By the end of the day, the 3-year ACGB yield had crept up 1bp to 0.22%, the 10-year yield had increased by 5bps to 0.88% while the 20-year yield finished 1bp higher at 1.42%.

Inflation index up; Sep quarter CPI to jump?

05 October 2020

Summary: Melbourne Institute inflation index inches up in September; annual rate steady; implies CPI jump in September quarter.


Despite the RBA’s desire for a higher inflation rate, ostensibly to combat recessions, attempts to accelerate inflation through record-low interest rates have failed to date. The RBA’s stated objective is to achieve an inflation rate of between 2% and 3%, “on average, over time.” Since the GFC, Australia’s inflation rate has been trending lower and lower; then the “coronavirus recession” crushed it in the June quarter.

The Melbourne Institute’s latest Inflation Gauge index inched up by 0.1% through September. The increase follows a 0.1% rise in August and a 0.9% jump in July. On an annual basis, the index increased by 1.3%, the same rate as in August and July.

Commonwealth bond yields moved higher, to some degree following US Treasury yields in overnight trading. By the end of the day, the 3-year ACGB yield had crept up 1bp to 0.22%, the 10-year yield had increased by 5bps to 0.88% while the 20-year yield finished 1bp higher at 1.42%.

The Melbourne Institute’s Inflation Gauge is an attempt to replicate the ABS consumer price index (CPI) on a monthly basis. It has turned out to be a reliable leading indicator of the CPI, although there are periods in which the Inflation Gauge and the CPI have diverged for as long as twelve months. On average, the Inflation Gauge’s annual rate tends to overestimate the ABS headline rate by an average of a little under 0.1%.

US jobless rate below 8% in September

02 October 2020

Summary: September non-farm payrolls increase by over 650,000; jobless rate down considerably but aided by lower participation rate; still 11 million below Feb 2020 level; employment-to-population ratio up for fifth consecutive month; underemployment rate down again but still in low-teens.


The US economy ceased producing jobs in net terms as infection controls began to be implemented in March. The unemployment rate had been around 3.5% but that changed as job losses began to surge through March and April. May’s non-farm employment report represented a turning point and subsequent months have continued to provide substantial employment gains.

According to the US Bureau of Labor Statistics, the US economy created an additional 0.661 million jobs in the non-farm sector in September. The increase was noticeably below the 0.865 million which had been generally expected and less than the 1.489 million jobs which had been added in August after revisions. However, employment figures for July and August were revised up by a total of 145,000.

The unemployment rate dropped from August’s rate of 8.4% to 7.9%. The total number of unemployed decreased by 0.970 million to 12.580 million while the total number of people who are either employed or looking for work decreased by 695,000 to 160.143 million. The fall in the number of people in the labour force reduced the participation rate from August’s rate of 61.7% to 61.4%.

“Last month, there were more jobs in leisure and hospitality, retail and healthcare and social assistance. However, employment in local and state government education fell. There were still nearly 11 million fewer non-farm payroll jobs than before the crisis broke,” said ANZ senior economist Cherelle Murphy.

US PCE inflation above 1.5% in August

01 October 2020

Summary: US Fed’s favoured inflation measure rises 0.3%; in line with market expectations; previous month revised up; annual rate up again; reaction by Treasury bond yields mixed.


One of the US Fed’s favoured measures of inflation is the change in the core personal consumption expenditures (PCE) price index. After hitting the Fed’s target at the time of 2.0% in mid-2018, the annual rate then hovered in a range between 1.8% and 2.0% before it eased back to a range between 1.5% and 1.8% through 2019. It then plummeted below 1.0% in April 2020 before rising in recent months.

The latest figures have now been published by the Bureau of Economic Analysis as part of the August personal income and expenditures report. Core PCE prices increased by 0.3% over the month, in line with expectations but lower than July’s increase after it was revised up from 0.3%. On a 12-month basis, the core PCE inflation rate accelerated for a fourth consecutive month, from July’s revised rate of 1.4% to 1.6%.

US Treasury bond yields reacted in a mixed fashion on the day. By the close of business, the 2-year Treasury bond yield had lost 2bps to 0.13%, the 10-year yield remained unchanged at 0.68% while the 30-year yield finished 1bp higher at 1.46%.

In terms of US Fed policy, expectations of any change in the federal funds rate over the next 12 months retained a slight easing bias. OIS contracts for September implied an effective federal funds rate of 0.077%, about 1bp below the current spot rate.

The core version of PCE strips out energy and food components, which are volatile from month to month, in an attempt to identify the prevailing trend. It’s not the only measure of inflation used by the Fed; it also tracks the Consumer Price Index (CPI) and the Producer Price Index (PPI) from the Department of Labor. However, it is the one measure which is most often referred to in FOMC minutes.

New orders, production drag on ISM PMI

01 October 2020

Summary: ISM purchasing managers index retreats slightly; reading just below consensus expectation; “sharp fall in new orders”; manufacturing “improving” but “far from full recovery”; US economy growing at solid pace.


US purchasing managers’ index (PMI) readings reached a cyclical peak in September 2017 before they started a downtrend which stabilised in late 2019 after a truce of sorts was made with the Chinese regarding trade. March’s report signalled a contraction in US manufacturing activity had begun; it stayed in this state until June.

According to the latest Institute of Supply Management (ISM) survey, its Purchasing Managers Index recorded a reading of 55.4% in September. The result was slightly below the expected figure of 55.9% and lower than August’s reading of 56.0%. The average reading since 1948 is 52.9% and any reading above 50% implies an expansion in the manufacturing sector. A reading “above 42.8%, over a period of time, generally indicates an expansion of the overall economy,” according to the ISM.

“There was a sharp fall in new orders and production eased. Delivery times increased as did employment and inventories but these components tend to lag behind orders. All in all, manufacturing is improving but is still a long way from full recovery,” said ANZ economist Kishti Sen.

US Treasury bond yields reacted in a mixed fashion on the day. By the close of business, the 2-year Treasury bond yield had lost 2bps to 0.13%, the 10-year yield remained unchanged at 0.68% while the 30-year yield finished 1bp higher at 1.46%.

Purchasing Managers’ Indices (PMIs) are economic indicators derived from monthly surveys of executives in private-sector companies. They are diffusion indices, which means a reading of 50% represents no change from the previous period, while a reading under 50% implies respondents reported a deterioration on average. They are particularly useful as a leading indicator.

Manufacturing PMI figures appear to lead US GDP by several months despite a considerable error in any given month. The chart below shows US GDP on a “year on year” basis (and not the BEA annualised basis) against US GDP implied by monthly PMI figures.

Upcoming NFP report bolstered by ADP numbers

30 September 2020

Summary: ADP payroll numbers jump in September; almost double consensus figure; August numbers revised up; strength of increase bolsters expectations of “reasonable” growth in upcoming non-farm payrolls (NFP) report; figures up across firms of all sizes; services sector accounts for 75% of gains; increase consistent with non-farm payroll expectations.


The ADP National Employment Report is a monthly report which provides an estimate of US non-farm employment in the private sector. Since the report began to be published in 2006, its employment figures have exhibited a high correlation with official non-farm payroll figures, although a large difference can arise in any individual month.

The ADP September report indicated private sector employment increased by 0.749 million, higher than the 0.65 million which had been generally expected. August’s increase was revised up from 428,000 to 481,000.

“Although it has been poorly correlated with the NFP data recently, the strength of ADP jobs growth will bolster expectations of reasonable jobs growth in the September non-farm payrolls report, albeit down from the +1.4 million reported last month,” said ANZ economist Adelaide Timbrell.

US Treasury yields rose by increasing amounts along the curve. By the close of business, the 2-year Treasury bond yield had inched up 1bp to 0.15%, the 10-year yield had added 3bps to 0.68% while the 30-year yield finished 4bps higher at 1.45%.

Employment numbers in net terms increased across businesses of all sizes. Firms with less than 50 employees filled a net 192,000 positions, mid-sized firms (50-499 employees) gained 259,000 positions while large businesses (500 or more employees) accounted for 297,000 additional employees.

Employment at service providers accounted for around 75% of the total net increase, or 552,000 positions in net terms. The “Trade, Transportation & Utilities” sector was the largest single source of gains, with 186,000 additional positions filled while the “Education & Health” and “Leisure & Hospitality” sectors each accounted for around 90,000 positions. Total jobs among goods producers increased by a net 196,000, with a 130,000 increase in the manufacturing sector providing a substantial majority of the gain.

Home approvals slip, “tracking at subdued levels”

30 September 2020

Summary: Home approval numbers slip; decline in line with expected figure; monthly approvals down 14.6% compared to December 2019; Victorian lockdown not reflected in release;  house approvals up but apartment approvals drop; economists pessimistic as population, jobs market weigh; non-residential approvals up.


Approvals for dwellings, that is apartments and houses, had been heading south since mid-2018. As an indicator of investor confidence, falling approvals had presented a worrying signal, not just for the building sector but for the overall economy. However, approval figures from late-2019 and the early months of 2020 painted a picture of a recovery taking place, even as late as April. Recent months’ figures have been volatile.

The Australian Bureau of Statistics has released the latest figures from August and total residential approvals slipped by 1.6% on a seasonally-adjusted basis. The slight fall over the month was largely in line with the 2.0% decline which had been generally expected but in contrast with July’s 12.2% increase after revisions. Total approvals increased by just 0.6% on an annual basis, a fairly significant slowdown from July’s comparable figure of 6.9% after it was revised up from 6.3%.

“Approvals are still tracking at subdued levels overall, with monthly approvals still down 14.6% vs December 2019,” said Westpac senior economist Matthew Hassan.

The figures were released at about the same time as August’s private credit report and Commonwealth bond yields moved a little higher. By the end of the day, 3-year and 10-year ACGB yields had each crept up 1bp to 0.21% and 0.84% respectively while the 20-year yield finished 2bps higher at 1.41%.

In the cash futures market, expectations of a change in the actual cash rate, currently at 0.13%, continued to favour a slight easing. At the end of the day, contract prices implied the cash rate would trade in a range between 0.065% and 0.085% through to the end of 2021.

Hassan noted “the impacts of the Victorian lockdown beginning early August were not reflected in this release. The state posted a moderate increase of 1.8% due to the time lag, though impacts will surely be seen in coming months.”

Approvals for new houses increased by 4.6% over the month after rising by 8.1% in July after revisions. On a 12-month basis, house approvals were 12.3% higher than they were in August 2019.

Bank lending flat; jobs market weighs

30 September 2020

Summary: Private sector credit flat after three months of falls; steady growth in owner-occupier segment offset by falls in business loans, personal debt; business credit expected to decline “for some time”; “struggling” housing credit linked to “fragile” jobs market.


The pace of lending to the non-bank private sector by financial institutions in Australia has been trending down since October 2015. Private sector credit growth appeared to have stabilised in the September quarter of 2018 but the annual growth rate then continued to deteriorate through to the end of 2019. The early months of 2020 provided some positive signs but they disappeared in April.

According to the latest RBA figures, private sector credit remained unchanged in August following three consecutive months of contraction. The result was slightly above the -0.1% which had been generally expected and above July’s -0.1%. However, the annual growth rate slowed to 2.2% from July’s comparable rate of 2.4%.

Owner-occupier loans continued to grow steadily but their growth was offset by falls in business loans and personal debt. The figures were released at about the same time as August home approvals data and Commonwealth bond yields moved a little higher. By the end of the day, 3-year and 10-year ACGB yields had each crept up 1bp to 0.21% and 0.84% respectively while the 20-year yield finished 2bps higher at 1.41%.

In the cash futures market, expectations of a change in the actual cash rate, currently at 0.13%, continued to favour a slight easing. At the end of the day, contract prices implied the cash rate would trade in a range between 0.065% and 0.085% through to the end of 2021.

The traditional driver of loan growth rates, the owner-occupier segment, grew by 0.4% over the month, the same rate as in the previous three months. The sector’s 12-month growth rate remained at 5.4%.

Growth rates in the business sector had been slowing until they picked up in the first quarter, with an especially large increase in March which was followed by a small increase in April. The slowdown restarted in May and it has continued through to August as business credit contracted by 0.4%, a little higher than the 0.6% fall in July. The segment’s annual growth rate slowed from July’s rate of 3.7% to 2.9%.

“Renewed optimism” among US consumers

29 September 2020

Summary: US consumer confidence jumps above long-term average; view of present and future conditions both improve; “renewed optimism” in short-term outlook; rise attributed to low interest rates, jobs recovery, higher share prices; “labour market indicator consistent with sluggish recovery”.


US consumer confidence collapsed in late 2007 as the US housing bubble burst and the US economy went into recession. By 2016, it had clawed its way back to neutral and then went from strength to strength until late 2018. Measures of consumer confidence then oscillated within a fairly narrow band at historically high levels until they collapsed earlier this year.

The latest Conference Board survey held during the first half of September indicated US consumer confidence has jumped back above its long-term average. September’s Consumer Confidence Index registered 101.8, well above the median consensus figure of 90 and considerably higher than August’s final figure of 86.3. Consumers’ views of present conditions and of future conditions both improved significantly from those held at the time of the August survey.

“A more favourable view of current business and labour market conditions, coupled with renewed optimism about the short-term outlook, helped spur this month’s rebound in confidence. Consumers also expressed greater optimism about their short-term financial prospects…” said Lynn Franco, a senior director at The Conference Board.

Longer-term US Treasury bond yields reacted in a mixed fashion. By the end of the day, the 2-year Treasury bond yield had added 2bps to 0.14%, the 10-year yield had slipped 1bp to 0.65% while the 30-year yield finished unchanged at 1.41%.

In terms of US Fed policy, expectations of any change in the federal funds rate over the next 12 months retained a slight easing bias. OIS contracts for November implied an effective federal funds rate of 0.076%, about 1.5bps below the current spot rate.

Click for more news