JCB find the YieldReport to be an invaluable summary of all debt market activity. Whilst we are focussed on the highest grade bonds it is important to see what is..Angus Coote, Executive Director, JCB Active Bond Fund
Euro-zone GDP outlook less grim, sentiment index up again
29 September 2020
Summary: Euro-zone composite sentiment index improves; above expectations; all major economies’ indices improve; sovereign bond yields modestly lower; index implies GDP smaller contraction.
The European Commission’s Economic Sentiment Indicator (ESI) is a composite index comprised of five differently-weighted sectoral confidence indicators. It is heavily weighted towards confidence surveys from the business sector; the consumer confidence sub-index only accounts for 20% of the ESI. However, it has a good relationship with euro-zone GDP, although not as a leading indicator.
The ESI produced a reading of 91.1 in September, above the market’s expected figure of 89.3 and higher than August’s revised reading of 87.5. The average reading since 1985 has been just under 100.
Overall sentiment in the euro-zone improved as all five confidence sub-indices increased. On a geographical basis, the ESI rose in most euro-zone economies, including the larger ones of Germany, France, Italy and Spain.
German and French bond yields lost ground. By the end of the day, German and French 10-year bond yields had each shed 2bps to -0.55% and -0.25% respectively.
End-of-quarter ESI and annual euro-zone GDP growth rates are strongly correlated. This latest reading corresponds to a year-to-September growth rate of -0.30%, up from August’s implied growth rate of -1.10%.
German economy “stabilizing” despite infection numbers
24 September 2020
Summary: ifo business climate index increases for fifth consecutive month; a little under expectations; German economy stabilizing “despite rising infection numbers”;
Following a recession in 2009/2010, ifo Institute’s business climate index largely ignored the European debt-crisis of 2010-2012, remaining at average-to-elevated levels through to early-2020. However, the index was quick to react in the March survey, falling precipitously. The rebound which began in May has continued so far.
According to the latest figures released by the Institute, its business climate index increased for a fifth consecutive month to 93.4 in September. The reading was a little below the expected reading of 93.9 but 0.9 points below August’s final reading of 90.4. The average reading since January 2005 is just above 97.
The expectations index continued to increase, rising from August’s figure of 97.5 to 97.7 in September, a little below the expected figure of 98.0. The current situation index rose from 87.9 to 89.2.
Clemens Fuest, the president of the ifo Institute, said companies “also expect their business to recover further. The German economy is stabilizing despite rising infection numbers.”
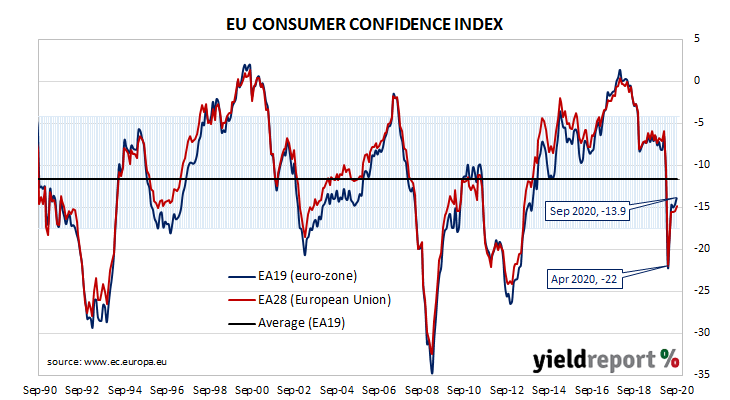
Summary: Euro-zone households slightly less pessimistic again in September; above consensus expectation but at level described as “lacklustre”; still below long-term average; euro-zone bond yields up slightly.
EU consumer confidence plunged during the GFC and again in 2011/12 during the European debt crisis. It fell back significantly in late 2018 but only to a level which corresponds to significant optimism among households. After a plunge took place in April 2020, a recovery of sorts took place through May and June. More recent readings have moved higher but at a slow pace.
The September survey conducted by the European Commission indicated its Consumer Confidence index has increased to -13.9. The reading was above the -15.0 which had been expected and higher than August’s final figure of -14.7. The average reading since the beginning of 1985 has been -11.6.
Westpac senior economist Elliot Clarke said “consumer confidence remained lacklustre.”
The report had a modest effect on major European bond markets. By the end of the day, the German 10-year bund yield had gained 2bps to -0.51% while the French 10-year OAT yield inched up 1bp to -0.24%.
In May, ASIC warned consumers about some investment managers’ claims comparing their fixed-term investment products to bank term deposits. ASIC’s concern centred on some issuers’ claims their products were alternatives or substitutes to term deposits. The regulator said some issuers may not be well-capitalised nor supervised by the Australian Prudential Regulation Authority (APRA). Additionally, such investments were not protected by the Government’s Financial Claims Scheme and they may be “backed by concentrated portfolios of higher risk unlisted and illiquid assets.”
Now ASIC is looking at the names given to investment funds “cash” investment products. It said it had assessed 350 funds in the cash, fixed-income, mortgage and property sectors. These funds held in excess of $65 billion in assets.
Cash is understood to be something which can be withdrawn quickly and at a known value.
It found “confusing and inappropriate product labels” on 14 cash funds. ASIC described some funds’ underlying assets as “more akin to a bond or diversified fund” and thus the funds had a higher risk profile with less liquidity than a traditional cash fund. Funds described as “enhanced cash” or “cash plus” figured significantly.
ASIC stated a mismatch between investors’ expectations of withdrawal from a fund and funds’ own actual redemption practices also presented a problem “in a small number of funds”. Three funds were found to have a “significant mismatch between redemption features and asset liquidity”. The short redemption terms did not line up with the nature of the underlying assets.
Undertakings from over a dozen funds were obtained to change their name to something more appropriate or at least review the justification for referring to their investments as cash funds. Some funds responded by changing the assets in their funds and one fund went so far as to liquidate itself.
ASIC noted most funds were appropriately labelled, although its “engagement with some responsible entities is continuing.”
US leading index continues rise but “downside risks” remain
18 September 2020
Summary: US leading index increases for fourth consecutive month; increase slightly less than expected; July increase revised up; index remains in recession territory, downside risks present; “substantially weakened economic conditions” at start of 2021.
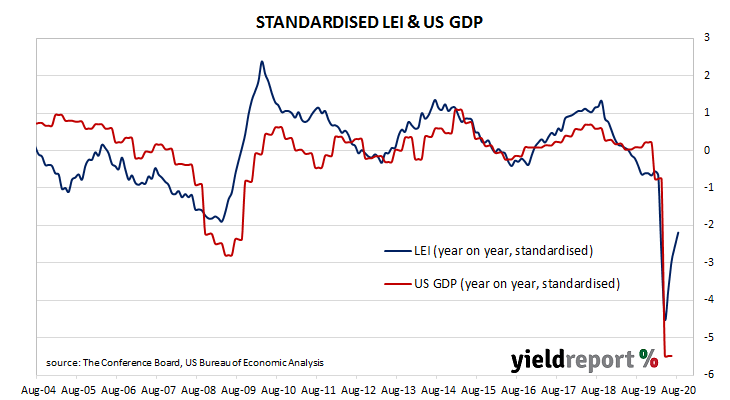
The Conference Board Leading Economic Index (LEI) is a composite index composed of ten sub-indices which are thought to be sensitive to changes in the US economy. The Conference Board describes it as an index which attempts to signal growth peaks and troughs; turning points in the index have historically occurred prior to changes in aggregate economic activity. Readings from March and April signalled “a deep US recession” but more recent readings indicate the worst has passed.
The latest reading of the LEI indicates it rose by 1.2% in August. The result was slightly less than the 1.3% increase which had been generally expected and noticeably less than July’s 2.0% after it was revised up from 1.4%. On an annual basis, the LEI growth rate increased from July’s revised figure of -6.6% to -5.3%.
“Despite the improvement, the LEI remains in recession territory, still 4.7 percent below its February level. Weakening in new orders for capital goods, residential construction, consumers’ outlook and financial conditions point to increasing downside risks to the economic recovery,” said Ataman Ozyildirim, Senior Director of Economic Research at The Conference Board.
Changes over time can be large but once they are standardised, a clearer relationship with GDP emerges. The latest reading implies a year-on-year growth rate of -1.3% in November.
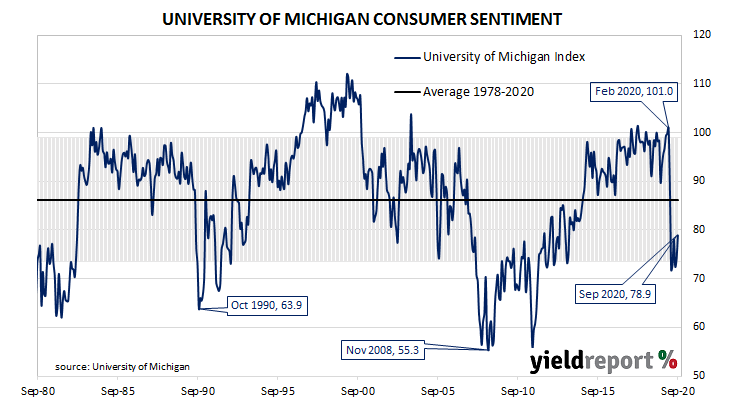
Summary: US consumer confidence up in September; index at highest reading since April low; presidential election beginning to impact expectations; vaccination timetable also a factor in coming months.
US consumer confidence started 2020 at an elevated level. However, by March, surveys had begun to reflect a growing uneasiness with the global spread of COVID-19 and its reach into the US. After a plunge in April, US household confidence began to recover, albeit in a haphazard fashion.
The latest survey conducted by the University of Michigan indicates the average confidence level of US households improved modestly to a somewhat-depressed level in September. The University’s preliminary reading from its Index of Consumer Sentiment registered 78.9, more than the generally expected figure of 75 and higher than August’s final figure of 74.1.
“Consumer sentiment improved in early September, reaching the top of the range it has travelled since April. While the recent gain was consistent with an unchanged flat trend, the data indicated that the election has begun to have an impact on expectations about future economic prospects,” said the University’s Surveys of Consumers chief economist, Richard Curtin.
US Treasury bond yields crept up uniformly along the curve. By the end of the day; US 2-year, 10-year and 30-year Treasury yields had all inched up 1bps to 0.14%, 0.70% and 1.45% respectively.
Curtin said the outcome of the US presidential election and the timetable for vaccinations are two factors he foresees as potential factors in dramatically reducing consumer confidence in coming months. However, he also added “the hardships endured by consumers can only be offset by renewed federal relief payments.”
“Disappointed”: US August retail sales up but marred by revisions
16 September 2020
Summary: Retail sales increases for fourth consecutive month; rise “disappointed”, less than expected; sales boosted by stores reopening; end of bonus $600 benefit “a likely key drag on further recovery”; majority of category segments increase sales over month; “Food, drinking places” the largest influence on total; US economy “losing momentum”, control group sales down by 0.1%..
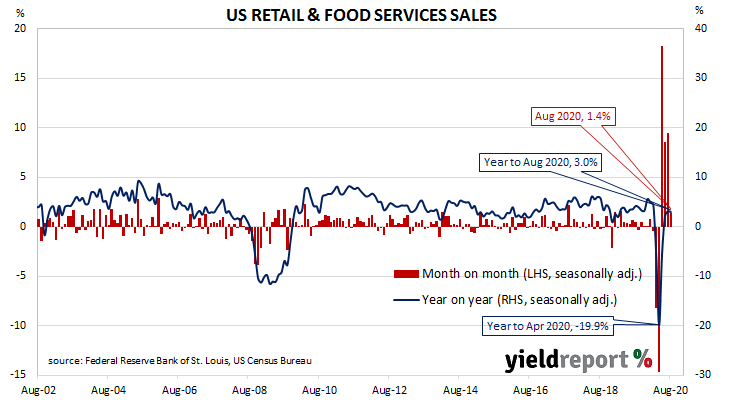
US retail sales had been trending up since late 2015 but, commencing in late 2018, a series of weak or negative monthly results led to a drop-off in the annual growth rate below 2.0% by the end of that year. Growth rates then increased in trend terms through 2019 and into early 2020 until pandemic restrictions sent it into negative territory. A “v-shaped” recovery has since taken place.
According to the latest “advance” sales numbers released by the US Census Bureau, total retail sales increased by 0.6% in August. The gain was less than the 1.0% increase which had been generally expected and less than the 0.9% rise after revisions in July. On an annual basis, the growth rate increased from July’s revised rate of 2.4% to 2.6%.
“August US retail sales disappointed, rising 0.6%…with a material downward revision to the previous month,” said ANZ economist Daniel Been.
The report was released on the same day as the US Fed’s FOMC meeting finished and US Treasury bond yields moved moderately higher. By the end of the day; the US 2-year Treasury yield had crept up 1bp to 0.14% while 10-year and 30-year yields each finished 3bps higher at 0.70% and 1.46% respectively.
“Sales continue to be boosted by the reopening of stores, but the expiration of the supplementary $600 weekly unemployment benefit was a likely key drag on further recovery and will hinder further recovery,” said NAB currency strategist Rodrigo Catril.
Leading index up, “broadly consistent” with solid Sep quarter
16 September 2020
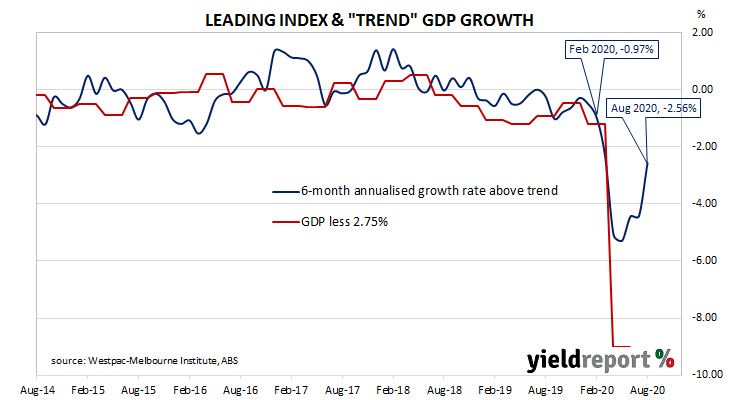
Summary: Leading index improves substantially in August; Westpac forecasts “solid” September quarter; index reading implies annual GDP growth to rise to around +0.25% later this year/early next year; index expected to become positive in September as March/April effects drop out of calculation; RBA forecast implies 1.3% growth in second half of 2020.
Westpac and the Melbourne Institute describe their Leading Index as a composite measure which attempts to estimate the likely pace of Australian economic growth over the next three to six months. After reaching a peak in early 2018, the index trended lower through 2018, 2019 and the early months of 2020 before plunging to recessionary levels in the second quarter. Readings from the third quarter have been markedly higher.
The latest reading of the six month annualised growth rate of the indicator increased substantially, from July’s revised figure of –4.42% to -2.56% in August.
“These signals are broadly consistent with Westpac’s view that growth in the September quarter will be a solid 1.8% despite an expected 4% contraction in Victoria, which accounts for around 25% of national economic activity,” said Westpac chief economist Bill Evans.
Index figures represent rates relative to trend-GDP growth, which is generally thought to be around 2.75% per annum. The index is said to lead GDP by three to six months, so theoretically the current reading represents an annualised GDP growth rate of around 0.25% in the last quarter of 2020 and/or the first quarter of 2021.
Commonwealth Government bond yields remained stable except at the ultra-long end, largely in line with US movements overnight. By the end of the day, 3-year and 10-year ACGB yields both remained unchanged at 0.27% and 0.92% respectively while the 20-year yield finished 1bp higher at 1.50%.
In the cash futures market, expectations of a lower actual cash rate, currently at 0.13%, firmed in a technical sense. By the end of the day, contracts implied the cash rate would trade in a range of 0.090% to 0.105% through to the end of 2021.
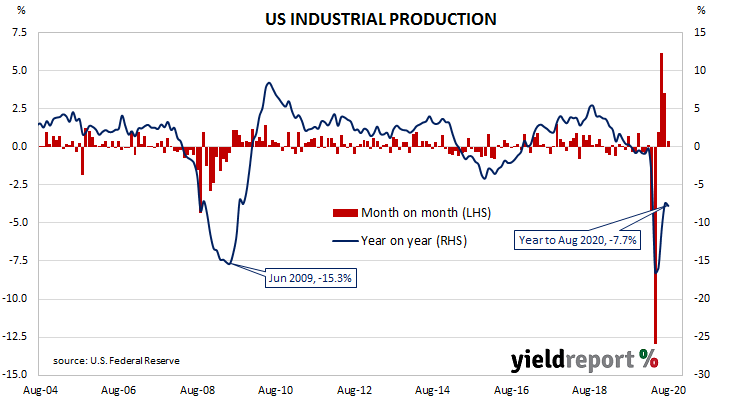
Summary: US output increases for fourth consecutive month; gain less than expected; August historically a quiet month; capacity utilisation increases slightly, still at depressed levels.
The Federal Reserve’s industrial production (IP) index measures real output from manufacturing, mining, electricity and gas company facilities located in the United States. These sectors are thought to be sensitive to consumer demand and so some leading indicators of GDP use industrial production figures as a component.
Production began recovering in May and subsequent months after collapsing through March and April.
US industrial production expanded by 0.4% on a seasonally adjusted basis in August, the fourth consecutive monthly increase. The result was less than the 1.0% expansion which had been expected and a fraction of July’s 3.5% after it was revised up from 3.0%. However, on an annual basis, the contraction rate increased from July’s revised figure of -7.4% to -7.7%.
“August is seasonally a quiet production month given retooling in the auto sector, while Boeing remains closed,” said Westpac senior economist Elliot Clarke.
US Treasury bond yields were largely unresponsive. By the end of the day; the US 2-year Treasury yield had slipped 1bp to 0.14%, the 10-year yield remained unchanged at 0.68% while the 30-year yield finished 1bp higher at 1.43%.
The same report includes US capacity utilisation figures which are generally accepted as an indicator of future investment expenditure and/or inflationary pressures. Capacity usage had hit a high for this business cycle in early 2019 before it began a downtrend which ended with April’s multi-decade low of 64.2%. August’s reading extended on previous gains as the capacity utilisation rate increased from July’s revised figure of 71.1% to 71.4%.
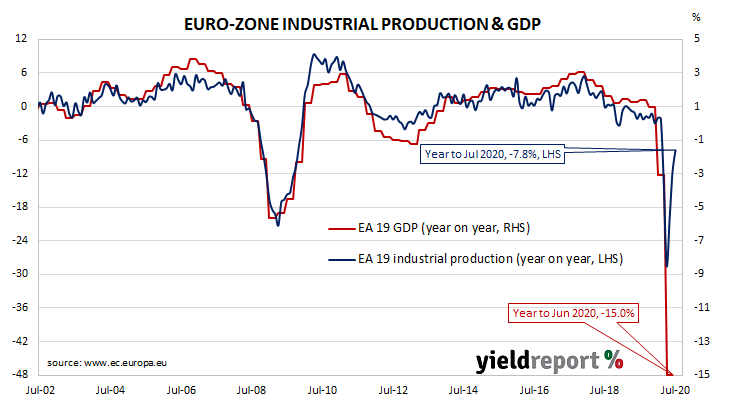
Euro-zone output up; Germany still 11.3% below Feb level
14 September 2020
Summary: Euro-zone industrial production continues recovery after huge falls in March, April; monthly figure more than consensus estimate; annual rate still very negative; German and French economies grow at less than overall rate.
Following a recession in 2009/2010 and the debt-crisis of 2010-2012 which flowed from it, euro-zone industrial production recovered and then reached a peak four years later in early-2016. Growth rates then fell and recovered through 2016/2017 before beginning a steady and persistent slowdown from the start of 2018. That decline was transformed into a plunge in March and April but the following months have produced an almost equally steep bounce.
According to the latest figures released by Eurostat, euro-zone industrial production expanded on a seasonally-adjusted basis by 4.1% in July. The increase was greater than the 2.7% increase which had been generally expected but substantially less than June’s revised figure of 9.5%. On an annual basis, the seasonally-adjusted growth rate increased from June’s revised rate of -11.6% to -7.8%*.
German and French 10-year bond yields hardly moved on the day. By the close of business, the German 10 year bund yield was unchanged at -0.48% while the French 10-year OAT yield had slipped 1bp to -0.19%.
Industrial production continued to recover across all four of the largest euro-zone economies, although Germany’s increase was somewhat of a laggard. Germany’s production expanded by 2.4% in July while the comparable figures for France, Spain and Italy were 3.8%, 7.4% and 9.4% respectively.
ANZ senior economist Felicity Emmett made an interesting observation. “The degree of divergence from pre-crisis readings across economies varies. In Germany, July production was 11.3% below February levels, in Italy it was 6.6% below and France was 7.2% below.”